Categorization of the performance measures

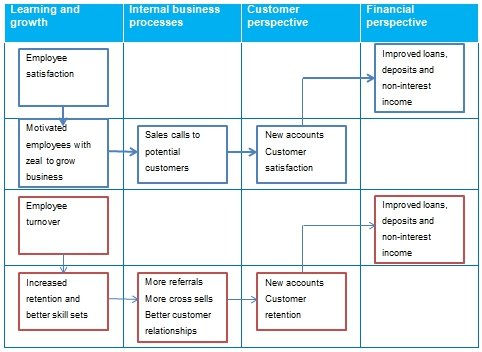
Illustrated above are two causal chains that could possibly lead to improved loans, deposits and non-interest income.
Analysis of the selected cause and effect chains
Chain one: Employee satisfaction > Motivated employees with the zeal to grow business>Sales calls to potential customers>New accounts, Customer satisfaction>Improved loans, deposits and non-interest income.
In this chain all the four perspectives are linked to illustrate how employee satisfaction can lead to a chain that eventually impacts on the ultimate goals in the financial perspective. Employee satisfaction is vital in any industry because it helps the people deliver in the overall strategy of the firm.
Employee satisfaction can be achieved through a number of ways: a good and friendly working environment, competitive remuneration, adequate technology at the work place, a good employee retention plan, learning and training and the opportunity for growth.
When all these measures are in place and the company has a motivated staff base, there is a higher chance of the staff driving the company agenda proactively e.g. through initiatives like calling potential customers. Proactive business development would then to lead to more accounts and better customer retention which ultimately lead to an increase in loans, deposits and non-interest income.
Chain two: Employee turnover>Increased employee retention and better skill sets>More referrals, More cross sells, Better customer relationships>New accounts, Customer retention>Improved loans, deposits and non-interest income.
In the second causal chain, employee turnover is the starting point. Employee retention has been established to have immense benefits especially with service oriented businesses like banks. Employee retention has in itself been considered a financial gain because of the resources it saves companies for example in hiring costs and training and development costs.
Employee retention also means that the company retains highly skilled labor that has a positive impact on customer service (Albright & Hibbets, 2001). With the best skills set in the different areas of expertise, there are likely to be more referrals and cross sells. This would lead to more accounts being opened, higher customer retention and as above, improvements in the loan book, deposits and non-interest income (Seber, n.d., para. 3).
In addition, retention can reduce the rate of default because of the experience of the credit team. This would lead to lower provisions for loans and a better bottom line. We can therefore not overstate the importance of employee retention in the successful realization of company strategies.
Balanced score card: CASE B
In this case, we will carry out a comparative review of the performance of the balanced score card implemented branches against the other 5 branches. Based on the performance, we will gauge the effectiveness of the balanced score card.
The table below shows a quick analysis of the performance of the 10 branches:
Graphical analysis of the branch performance

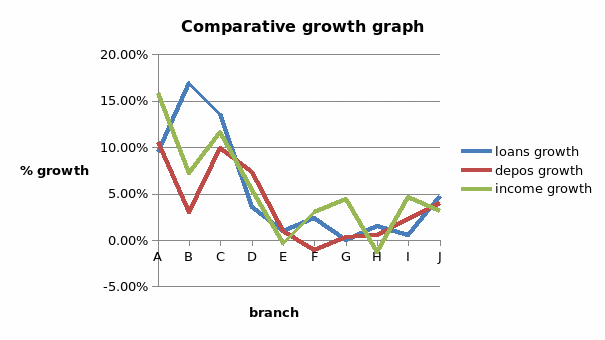
From the figures and graphs above, it is clear that the implementation of the balanced score card was effective. It can be seen that 4 out of the five branches where the balanced score card was implemented reported a positive growth in all the performance areas: loans, deposit growth and income growth.
The average growth for the 5 branches using the balanced score card was also much higher than the rest with a growth of 8.88%, 6.38% and 7.97% for loans, deposits and income respectively. This was in comparison of an average growth of 1.84%, 1.21% and 2.78% for loans, deposits and income respectively for the other 5 branches not using the balanced score card.
In fact, the average growth rate for loans for the 5 branches implementing the balanced score card was almost 8 times the average for the other five branches. The same pattern was evident for the deposits with the balanced score card branch average almost six times that of the other branches and more than double the growth for income.
It must however be noted from the above figures that the strategies employed by the managers in implementation affected the effectiveness of the balanced score card. In branch E, for example, when interviewed about the balanced score card, the employees seemed like they did not understand why they had targets.
They did not seem to understand how the BSC would help them achieve their goals and had no clear picture of what rewards they stood to gain if they met their targets. This situation clearly left the team unenthusiastic and unmotivated. The results recorded by branch E was a manifestation of the failure in implementation of the balanced score card by the branch management in branch E. Further, branch E was the only branch out of the 5 using the BSC that reported a negative growth in income.
It performed worse than G, I and J which were not even part of the BSC test group. It goes without saying that the branch management failed to communicate and engage effectively with their team at the branch.
For a successful implementation of the score card, the branch management should have had a session with the team to clearly articulate the objective of the score card and agree on a way forward on how to achieve their targets. By doing this, they would have gotten ‘buy in’ from the team and gotten more effort and support in their quest to grow the branch.
Branch A registered the highest growth in income because the staff seemed to have a very clear picture of all the areas they needed to adjust in order to get growth; they were clear that they needed to balance loans and deposits with growth. This allowed the branch to grow evenly in all the performance areas: loans, deposit and income.
Branch B registered high growth in loans but a low one in deposits. This led to a lower growth in income. The pattern of growth in branch B could be attributed to the fact that the loan representative had quite a clear picture of what the credit team needed to do to achieve growth in credit.
The teller in branch B seemed less enthusiastic about the balanced score card approach. This probably affected the performance of branch B because the tellers are the people involved in the mobilization of deposits.
Branch C on the other hand delivered good results because the teams seemed to have an understanding of what the BSC was about and how important the performance of each team member was to the success of the branch.
Conclusion
It was clear that the balanced score card is a good tool in improving performance as evidenced in the average and individual results of the test branches. However, the implementation must be gotten right for maximum benefits to be realized. Branch A had the highest average growth because the whole team seemed to have been part of the BSC process and owned the score card.
As evidenced in this branch, the balanced score card can achieve maximum benefits in the branch if management engage all staff in the implementation process (Silverthorne, 2008).
The managers must engage the staff and listen to their input, clearly communicate the purpose of using the BSC and share the individual and group benefits associated with meeting the set targets. It was also clear that all the four perspectives of the balanced score card play an important role in the realization of the overall company strategy.
Reference List
Albright, T., Davis, S. & Hibbets, A. (2001). Tri-Cities Community Bank: A Balanced Scorecard Case. Strategic Finance, 83(4), 54-60. Web.
Seber, L. (n.d.). The Advantages of Employee Retention: e how contributor. Web.
Silverthorne, S. (2008). Executing Strategy with the Balanced Scorecard. Thomson Learning, South Melbourne.