Introduction
An object in a circular motion has different velocities at different points. The circular motion of an object with constant speed experiences a change in direction at each point. As force acts on an object in motion, its acceleration and direction of force act towards the center of the circular path. Tension in the string helps to determine the force and the relation between physical quantities and force. We plotted graphs of dependent and independent variables on the vertical and horizontal axis respectively.
Objective
- The aim and objective of the experiment was to collect and use the experimental data for an object moving in a uniform circular motion to build graphical and mathematical models for the system.
- To define the correlation between independent and dependent variables.
Equipment
- Air link,
- centripetal force apparatus
- centripetal force apparatus masses
- circuit leads
- computer
- digital adapter
- photogate
- photogate cable
- low voltage power supply
- bench clamp
- long metal load
- short metal load
- right angle clamp
- triple beam balance
- wireless force sensor
Procedure
- In the first step, we adjusted the masses on free mass by fixing the same masses at a constant distance to balance the system.
- Angular speed and masses were kept constant throughout the experiment.
- We raised the force sensor using the right-angled clamp to adjust the radius of motion.
- To adjust the angular velocity, we lowered the voltage.
- We used the force sensors and photogate to find angular speed and tension in the string.
- We plotted a graph between force and time.
Data
Run 1
Run 2
Run 3
Run 4
First Data
- Time (t) = 28 seconds
- T = 0.559
- R = 0.082 meters
- F = 4.639
Second Data
- Time (t) =31 seconds
- T = 0.619
- R = 0.082 meters
- F = 5.049
Third Data
- Force (F) = Mass (m) * Gravity (g) = mg
- Mass = 1.25 kilograms
- F = 9.8*1.25
- F = 12.25 N
Analysis
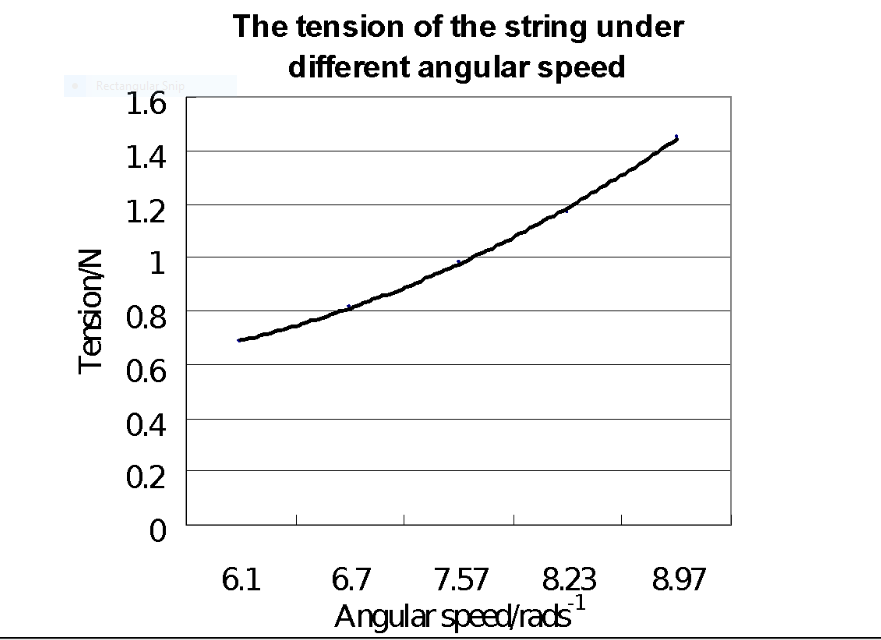
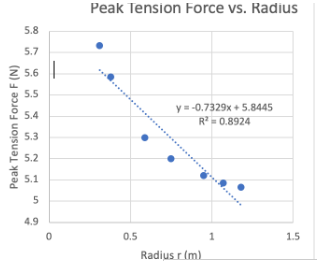
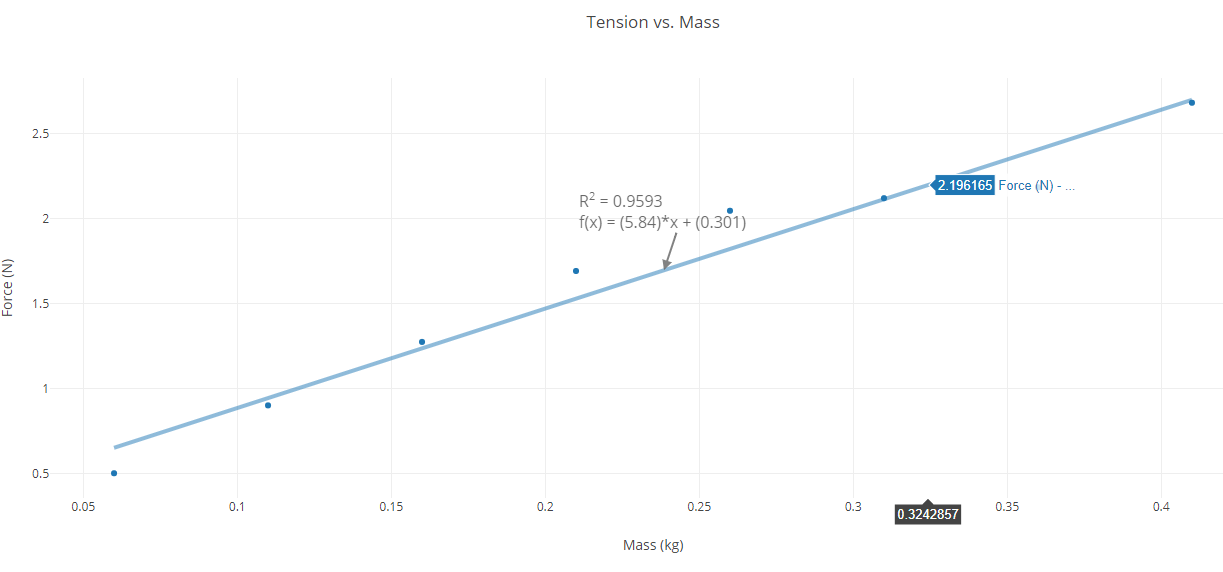
We first plotted a graph of tension against free mass, the radius of motion against tension, and the angular speed of the motion against tension. Dependent variables were plotted on the vertical axis, while independent variables were plotted on the horizontal axis. Force was put on the horizontal axis, and acceleration was plotted on the vertical axis. We needed a linear equation to get the solution to the problem. If the equation is non-linear, it should first be linearized to solve the problem. There is a need to remember shapes in solving the equation because the function on the force and acceleration graph resembles a quadratic equation.
The tension of cord VS Angular speed of motion
The tension of the cord is directly proportional to the square of angular speed of motion.

Tension of cord vs. radius of motion
Tension on the cord is inversely proportional to the radius of motion.

Tension of cord vs. mass of the free mass
The mass of the free mass is directly proportional to the tension on the cord.

Extended Model
The tension in the rope is dependent on the mass, angular speed, and radius of motion. Thus, the tension in the rope is directly proportional to free masses placed on all sides of the ropes. Further, the tension cord is directly proportional to the angular speed and inversely proportional to the radius of motion.
Tension (Ft) is directly proportional to mass. Thus;
Ft ∝ mass
The proportionality is removed by a constant (g)
Ft ∝ mg
Where g = 9.8 m/s
The angular speed of the system = 10rad/s
Mass = 75 g
Radius = 0.25 m.
Tension (Ft) in the rope =?
Mass = 0.075 kilograms
V = angular speed*radius
V = 10*0.25
V = 2.5 m/s
Ft = mv2 / r
Ft = 0.075 (2.5)2 / 0.25
Ft = 18.75 N
Sources of Errors
In a real application, the radius of rotation and angular speed of motion cannot be constant.
Recommendations
Future sensors should be applied to monitor the angular speed of motion and rotation radius to ensure that they remain constant.
Conclusion
This experiment aimed to learn the correlation between independent and dependent variables in this lab. We learned to generate physical and mathematical systems to define a relationship between quantities. We plotted graphs of dependent variables on the vertical axis while independent variables were plotted on the horizontal axis (Jones, 2014). Further, we found that tension in the rope is dependent on three variables but directly proportional to angular velocity and mass and inversely proportional to the radius of motion.
Reference
Jones, A. (2014).Centripetal Force Experiment. Brave Search.