Analyzing the Weather


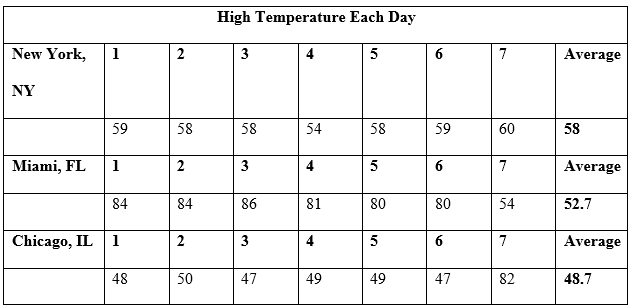
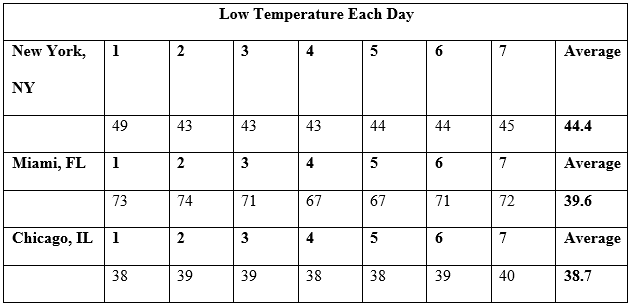
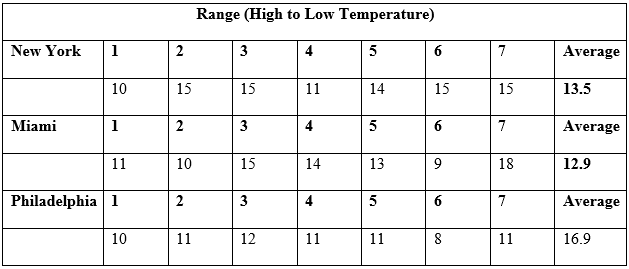
In order to demonstrate the entire palette of North American climate, the cities such as New York, Chicago, and Florida were chosen for this assignment. Since each represents a unique climate type, the analysis of their weather and the changes in it have provided good insight into the specifics of local environments. Although these locations are not enough to embrace the entirety of the varied American climate, they offer unique characteristics of the target settings, such as the proximity to the ocean, the propensity toward rapid changes in air pressure and the subsequent probability of cyclones, and similar properties of the target areas.
The climate in the selected location can be described as continental. The precipitation rates are quite high in New York, which makes the weather rather humid. As a result, the climate of New York is humid continental. By definition, the described type of climate implies noticeable temperature contrasts between seasons, with clear distinctions between summer and winter, as well as spring and autumn (National Climatic Data Center). However, it is noteworthy that a substantial part of New York is located in the climate zone described as humid subtropical (National Climatic Data Center). Therefore, the types of climate vary even across the state, causing the weather to fluctuate between continental and tropical.
The peaks and valleys observed in the temperature changes within Chicago area, in turn, can be explained by the fact that, unlike New York, Chicago is located quite far from the ocean. As a result, New York City is characterized by rather low changes in its annual temperature and, as a result, cool summers and mild winters. The temperature in the U.S. areas that are close to the middle of the continent, in turn, are less stable, with higher levels of thermal amplitude observed in different seasons (Tewari et al. 11). Florida, in turn, also has a very varied climate and massive differences in its temperature rates. (Wahl and Chambers 1248).
The described climate changes may also be attributed to comparatively low altitude of 6 feet. Compared to the 33 feet of New York, the specified difference might seem as minor, yet the latitude differences define the gap in the climate of the two states. In turn, the elevation of Chicago, which rises 593 feet above the sea level, is drastically higher than Florida or New York. The specified altitude partially explains the cold, harsh weather of Chicago (Jandaghian and Akbari 19).
Although testing the difference in the weather types of the cities in question would also deliver similar results in any other season, spring does not seem to be the most suitable time to test the changes in question. Namely, during spring, the drastic differences in hot and cold weather observed in humid continental climate is not as evident as it might be otherwise. However, spring is best for exploring the unique properties of the tropical continental climate, which implies multiple typhoons and rather windy weather conditions (Jandaghian and Akbari 19).
Local Geography
Area Code Analysis
The rea selected for this analysis is New York City, which means that the corresponding area code is 718 (North American Numbering Plan Administrator). Although the density of New York population varies form, one part of the city to another, the general density is quite high, currently sitting at the 27,000 people per m2 mark (Department of City Planning). However, even with the fluctuations in the density levels, the specified number places New York among the cities with the highest population density rate in the U.S. (Department of City Planning). Therefore, New York City can be considered rather densely populated (Boehm 102).
Indeed, looking at the map provided by the North American Numbering Plan Administrator (NANPA), one will realize that the city is quite populated, with most area codes being urban and not rural (Department of City Planning). Since rural places are known for being rather spacious, with fewer households and larger unpopulated areas, the lack thereof is a clear sign of a rise in population density, as the situation in New York City illustrates.
Businesses with Cardinal Directions in Their Name
Currently, there are 52 business directions with any of one of the four key directions in their name. In the course of the search, not only the companies that contained a standalone direction in their title but also the organizations that had the direction as a part of the compound noun were considered. It is quite curious that the East and West directions have proven to be the most frequently used, each constituting a part of 15 corresponding titles. However, the South direction came as a close second, forming 14 business names. In turn, the South direction turned out to be the least common one, being a part of only 9 entries.
The specified information indicates that most businesses tend to name themselves mostly either as a part of the West Side or the East Side of New York (New York Chamber of Commerce). In turn, the North direction is typically used to point out that New York is a northern state. Apparently, for the same reason, the “South” element of a toponym is typically avoided unless absolutely necessary.
Table 4. New York: Businesses with Cardinal Directions.
Ethnic Restaurants: Analysis
Representing a wide variety of cultures and ethnicities, New York City has quite a lot of ethnic restaurants. According to the New York Chamber of Commerce, New York restaurants are represented by traditional North American, French, Mexican, Italian, Caribbean, and Asian cuisine. The specified list provides a rather clear idea of what ethnic groups currently populate the city. Namely, New York is inhabited by African American, European American, Latin American, Asian, Turkish, French, and Italian groups (New York Chamber of Commerce). Though the accurate number of each restaurant is quite difficult to identity, roughly 5-7 of each are listed in the directory. Personally, I prefer to go to different restaurants depending on how I feel and what kind of experiences I want to have. So far, I have visited about 18 New York restaurants.
Ethnic Neighborhoods within the Community
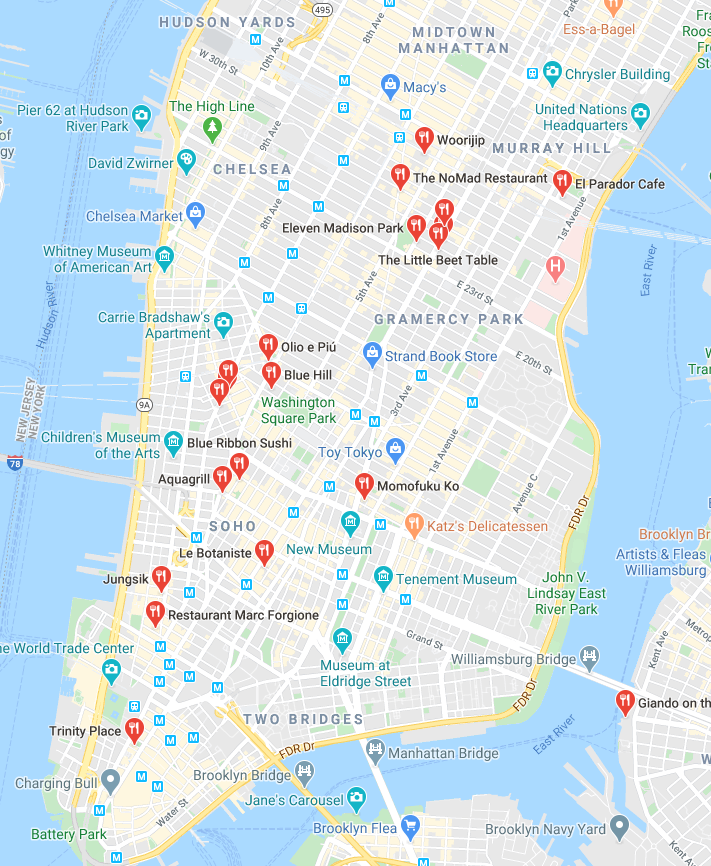
The New York community is represented by a plethora of diverse ethnic neighborhoods. By plotting some of the restaurants mentioned above on the map of New York, one will identify an approximate location of some of the most populous ethnic communities within the city. For example, the Roti Modern Mediterranean restaurant, which was one of the entries in the previous tasks, is surrounded by Locanda Verde, Piccola Cucina, and Dante NYC, which outline the Italian district of New York City. Namely, the specified restaurants circle the Little Italy area, outlining its ethnic characteristics quite clearly (see Fig. 1).
The same can be said about the Asian neighborhoods, namely, Chinatown and some areas of Flushing. Overall, despite the presence of certain boundaries between different neighborhoods, New York City seems to be extraordinarily diverse, with the key elements of major cultures being represented in it.

Works Cited
Boehm, Richard G. Geography: The Human and Physical World. McGraw Hill Education, 2018.
Department of City Planning. Population – New York City Population. 1.NYC. n.d.. Web.
Jandaghian, Zahra, and Hashem Akbari. “The Effect of Increasing Surface Albedo on Urban Climate and Air Quality: A Detailed Study for Sacramento, Houston, and Chicago.” Climate, vol. 6, no. 2, 2018, p. 19.
National Climatic Data Center. Climate of New York, NCDC. NoAA. Web.
New York Chamber of Commerce. Chamber Member Business Directory, ManhattanCC. n.d. Web.
North American Numbering Plan Administrator. NY – New York Inset Area. NationalNANPA. n.d. Web.
Tewari, Mukul, et al. “Interaction of Urban Heat Islands and Heat Waves under Current and Future Climate Conditions and Their Mitigation Using Green and Cool Roofs in New York City and Phoenix, Arizona.” Environmental Research Letters, vol. 14, no. 3, 2019, pp. 1-16.
Wahl, Thomas, and Don P. Chambers. “Climate Controls Multidecadal Variability in US Extreme Sea Level Records.” Journal of Geophysical Research: Oceans, vol. 121, no. 2, 2016, pp. 1274-1290.