Introductory Remarks
Markov Switching Model is widely used for analyzing economic developments (Kumah, 2007).
Bull and Bear market regime switches can be studied with the help of Markov Switching Model (Maheu, 2009).
Previous research on Markov Switching Theory provides deep insights into the current research topic (Hamilton, 1994).
Literature Review
Markov Switching Approach deals with studying time series data changes in stock markets (Kumah, 2007; Hamilton, 1994).
Single Markov Chains and Multiple Markov Switching Models allow identifying non-linearity of regime switches (Anas et al., 2004; Alliot et al., 2006).
Simulation-based stochastic volatility models enable the use of first-order Markov process for regime change analysis (Carvalho and Lopes, 2006):
- p (yt I xt, θ) ~ N (0, eλt/2),
- p (λt I xt-1, θ) ~ N (αSt + Φλt-1, σ2),
- Pr (St I Xt-1, θ) ~ pSt-1St,
where λt and St denote single state vectors referring to regime switches, while σ marks the volatility variance (Carvalho and Lopes, 2006).
Bull and Bear market regimes are associated with high and low risk probabilities and preferred risk aversion methods (Gordon and St-Amour, 2000);
Duration dependence theory:
- Bull and Bear market regimes switch in cycles;
- Lifecycle of one regime determines its switch to another one;
- External factors do not affect regime switches (Lunde, 2004).
Basic Data Regimes
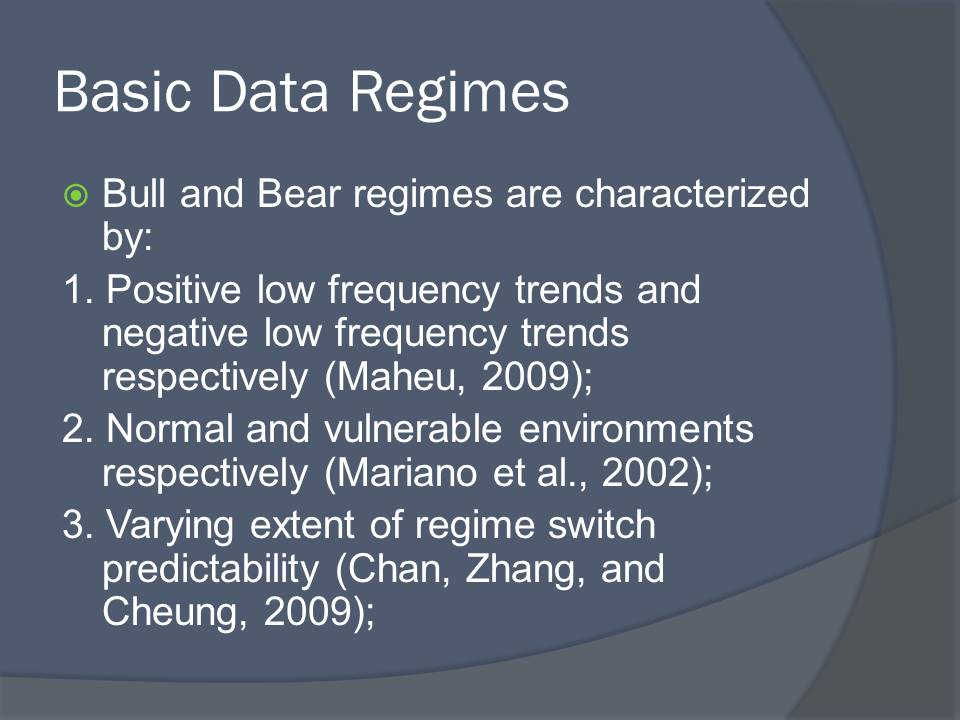
Bull and Bear regimes are characterized by:
- Positive low frequency trends and negative low frequency trends respectively (Maheu, 2009);
- Normal and vulnerable environments respectively (Mariano et al., 2002);
- Varying extent of regime switch predictability (Chan, Zhang, and Cheung, 2009).
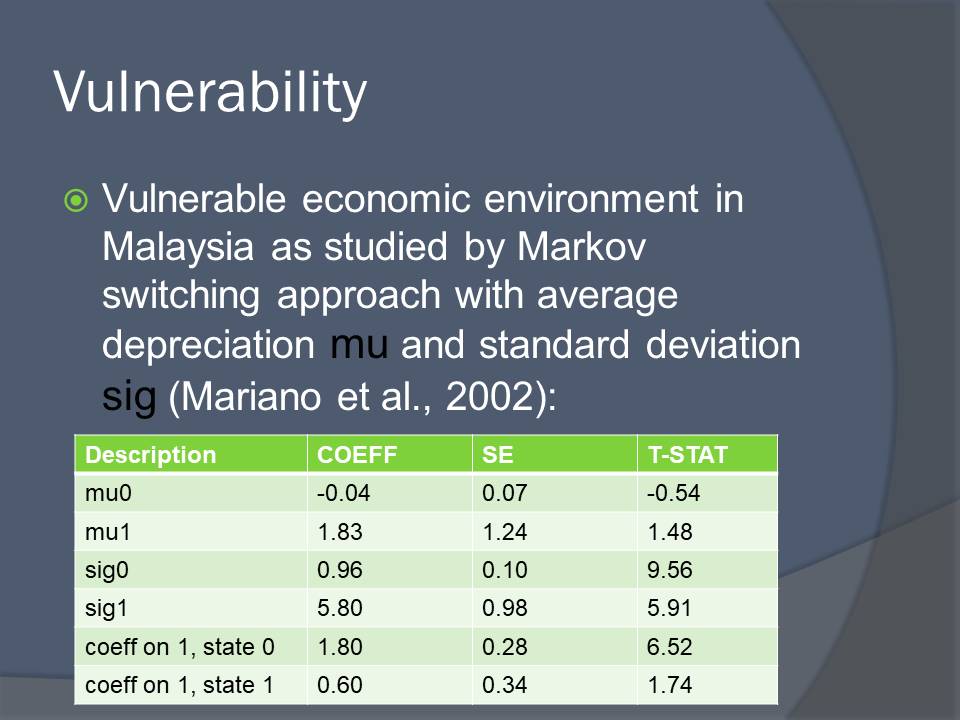
Vulnerability
Vulnerable economic environment in Malaysia as studied by Markov switching approach with average depreciation mu and standard deviation sig (Mariano et al., 2002).
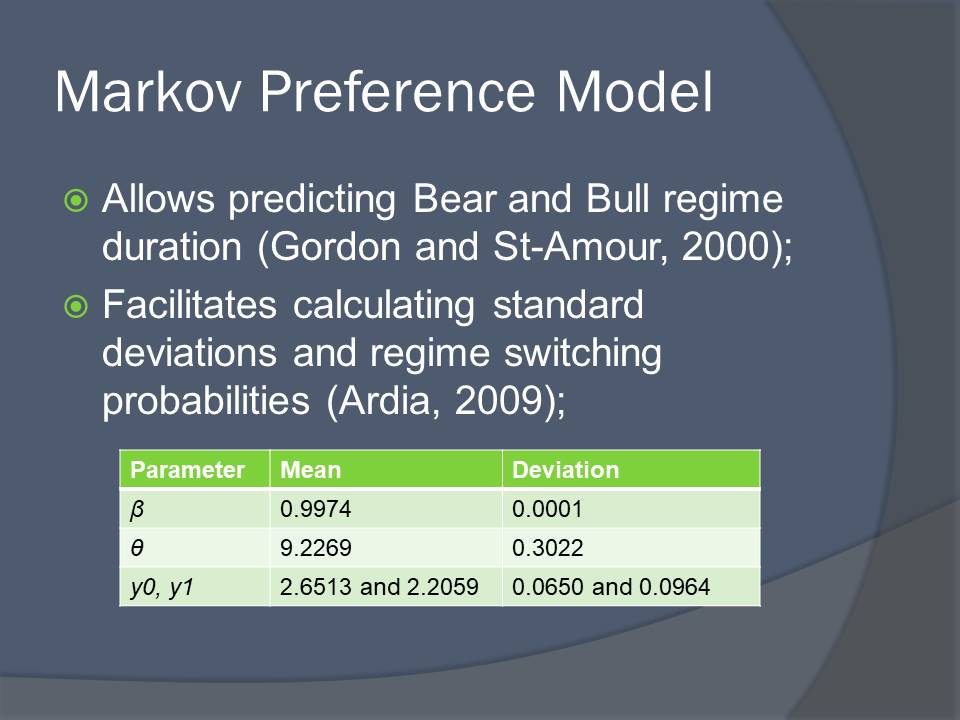
Markov Preference Model
Allows predicting Bear and Bull regime duration (Gordon and St-Amour, 2000);
Facilitates calculating standard deviations and regime switching probabilities (Ardia, 2009).
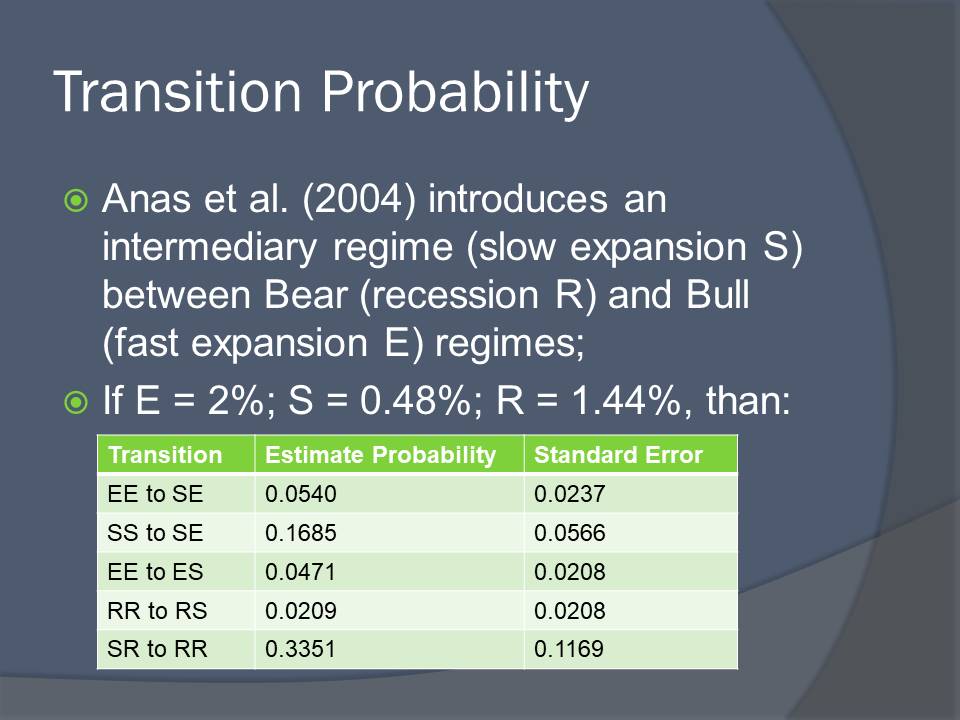
Transition Probability
Anas et al. (2004) introduces an intermediary regime (slow expansion S) between Bear (recession R) and Bull (fast expansion E) regimes;
If E = 2%; S = 0.48%; R = 1.44%, than:
Concluding Remarks
Markov Switching Model can be used to determine Bear and Bull market regime switching probabilities (Maheu, 2004);
Scholars prefer the non-linear nature of Markov Switching Model to time-linear testing approach (Anas et al., 2004);
Symmetry test, Wald test, generalized ADF unit root test, etc. are used to verify Markov Switching Model data (Xiao and Tan, 2006).
