Introduction
This study aims to propose an experiment in which the performance of the Delta Max paper airplane is compared to other paper airplane models in the context of the range and duration of the flight. The report provides data on the methodology for collecting, analyzing, and presenting the results and discusses the main strengths and weaknesses of the experiment.
Methodology
Primary Data Collection
This study is based on an experimental design in which primary data is collected directly and then subjected to statistical processing. For this purpose, five identical copies of different paper airplane models are each created and flown by the same person under the same physical conditions (no wind, ambient temperature, or air composition), which will minimize the effects of confounding variables (Thomas, 2022). In this case, it is assumed that differences in range and flight time, critical criteria for RED BULL PAPER WINGS, will be determined only by the shape of the paper airplane (RedBull, 2022). A five-fold run for each model is also based on the assumption that this will reduce errors and achieve an ideal average result (Phil, 2020). Thus, reliable primary data will be collected during experimental launches, eliminating the effect of any undesirable factors.
Range data collection will be measured directly with a laser meter. A similar mechanism is used on RED BULL PAPER WINGS and has improved accuracy over classical rulers and scales with systematic errors (RedBull, 2022). For reliable statistical analysis, it is critical not to change meter positions for different models so as not to cause distorted results. Measuring the range to one decimal place is also recommended to improve accuracy.
Analysis and Processing
Each sample’s range (in meters) and duration (in seconds) will be placed in an Excel spreadsheet. In addition to the mean value for each pattern, measures of central tendency and variation will also be determined to observe critical trends in flight characteristics (Table 1). The inferential test will use a parametric one-way ANOVA to determine if there were differences between the different models as independent samples: the comparison will be made in the context of both the range and duration of the paper aircraft flight. The parametric test will determine the statistical significance of the differences between the models, and, if found, the posterior test will determine the location of these differences. In other words, combined with descriptive analysis, inferential statistics will answer the key research question and determine which model performed best.
Table 1: Descriptive statistics for the five models.
Graphical Representation
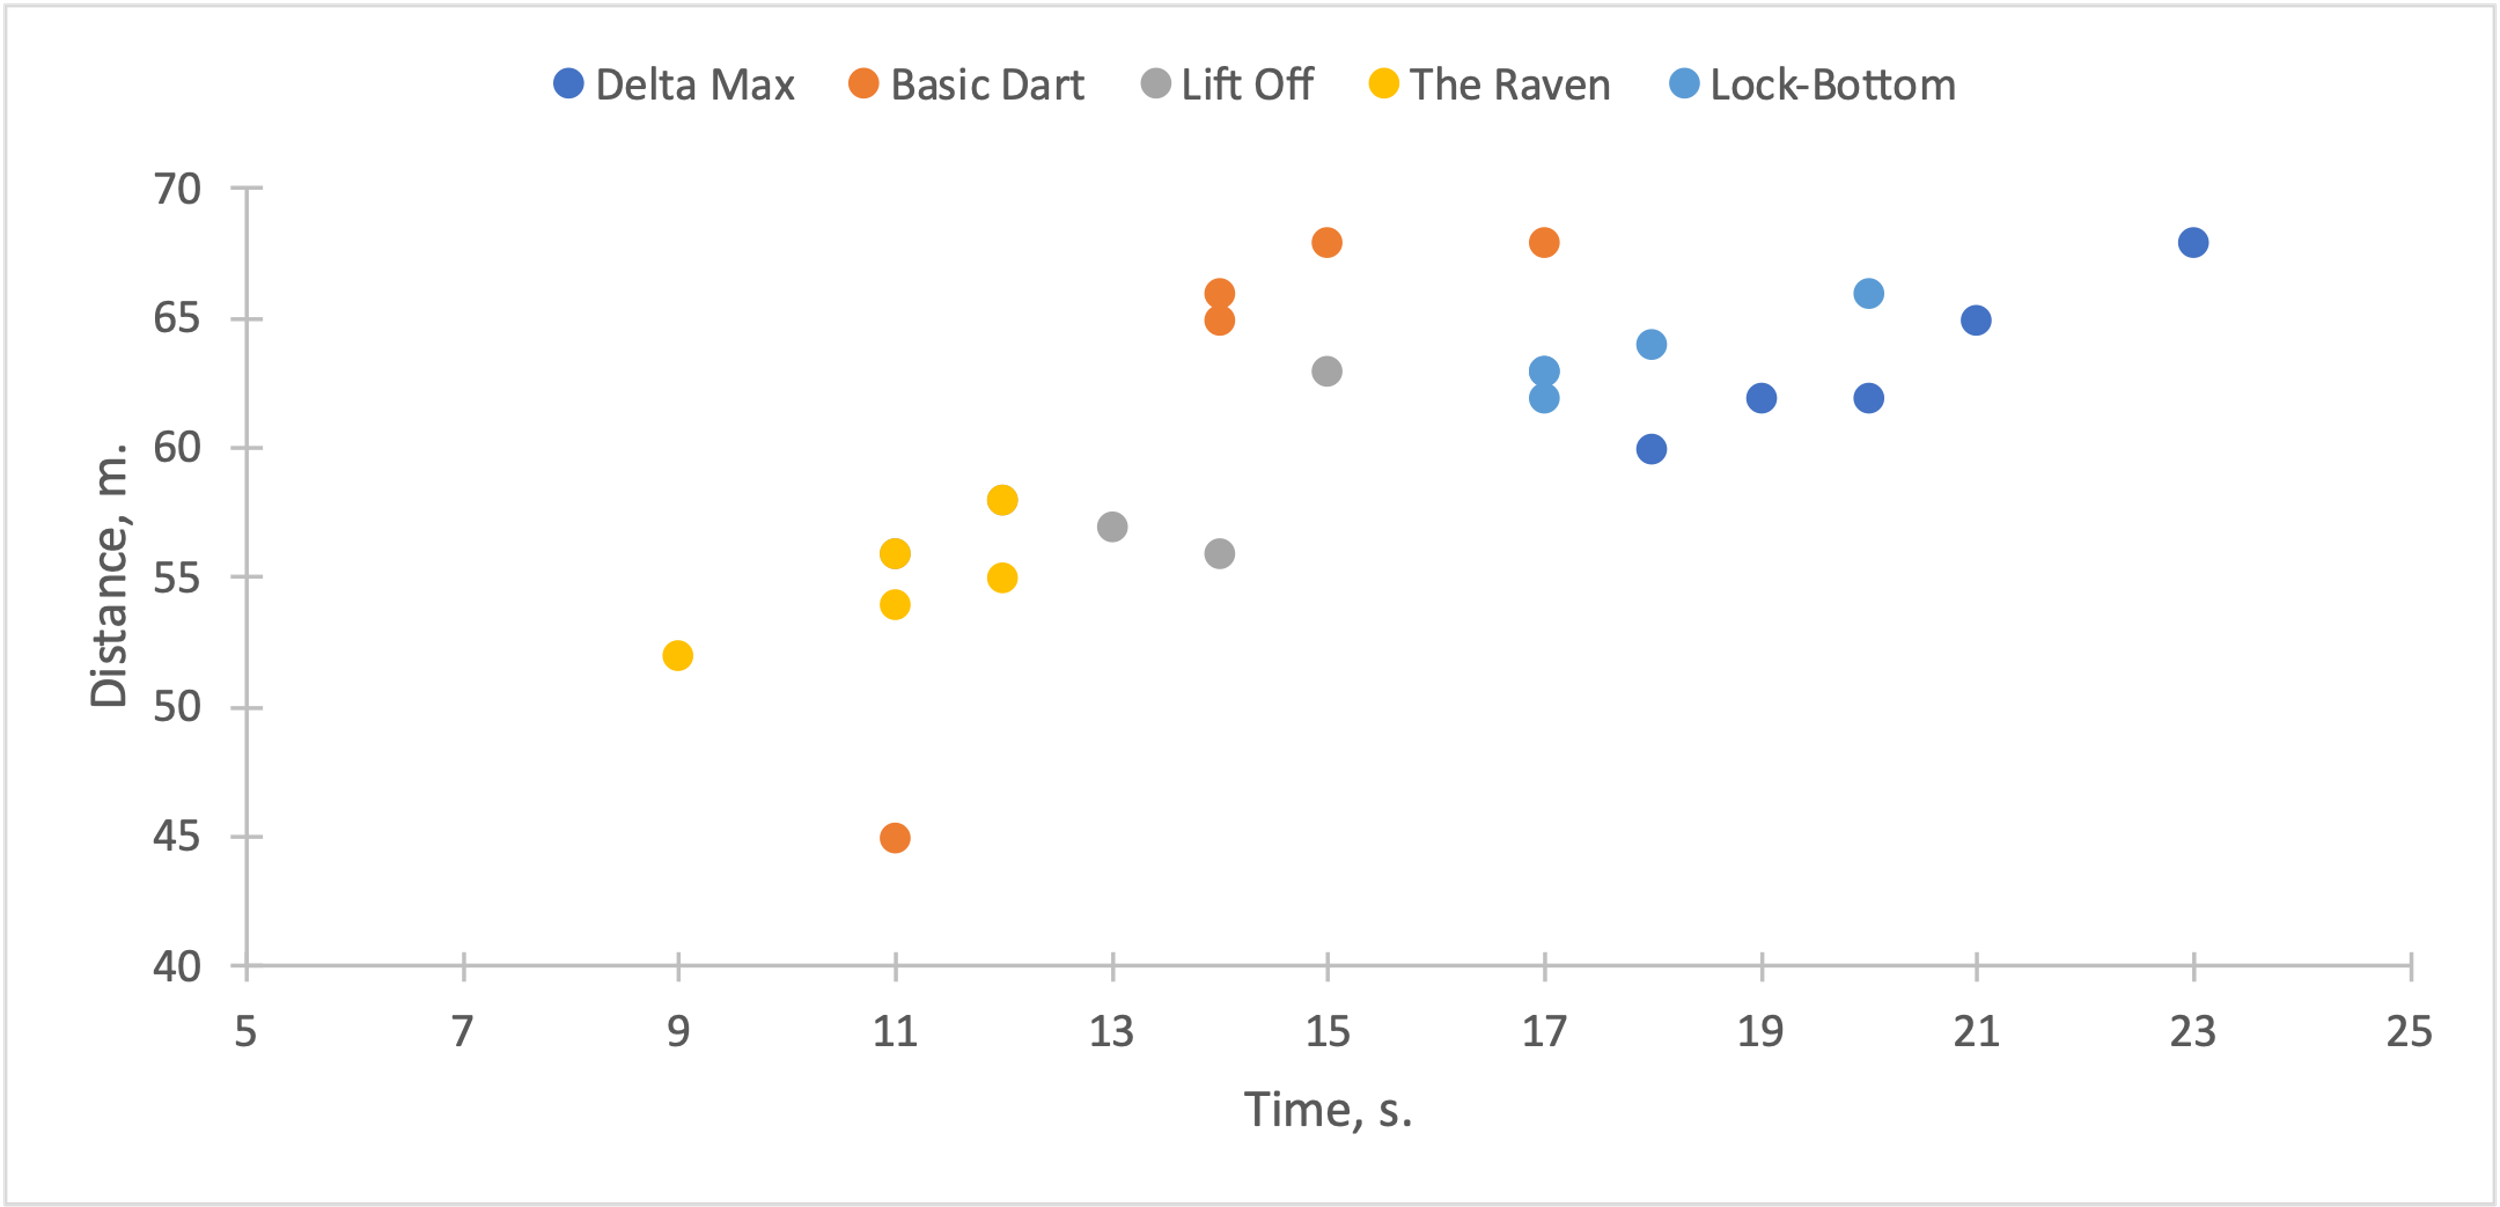
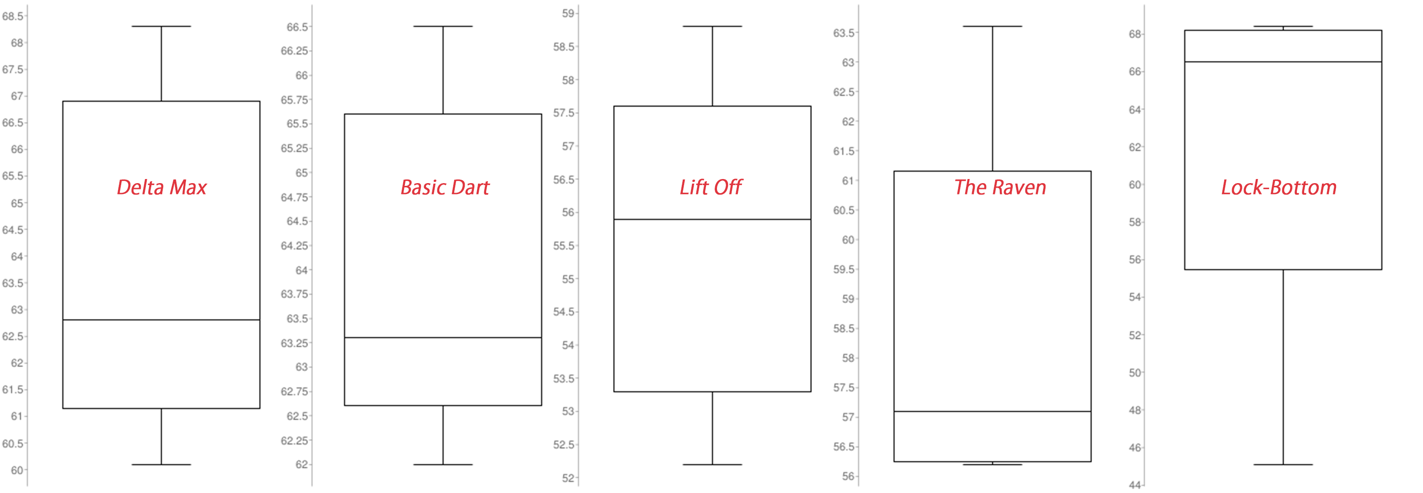
Most of the visualization of the primary data will be in the form of tables (e.g., Table 2), but it is also acceptable to use graphical representations in the form of coordinate dependencies of the flight range on the time it takes to fly, or boxplots (Figure 1 and Figure 2). Notably, if linear regressions are plotted for each model, it will thus be possible to determine the average speed of the paper airplane in flight (Bohacek, 2021). Thus, the primary visual representations would include tables, boxplots, and coordinate plots.
Table 2: Primary data collected for five paper airplane models in five dimensions.


Critical Review
The proposed design has several strengths and weaknesses, potentially affecting the validity of the results. First, the design is about eliminating confounding variables and controlling them, so distortion is expected to be minimal. Second, robust statistical inferential tests are used for the analysis, which means the validity of the results will be confirmed. On the other hand, the limitations of the proposed experimental design include using the same individual. Although this strategy initially aims to equalize strength in each launch, the effect of arm fatigue, which occurs by the last of 25 paper airplane throws, cannot be excluded (Nagwa, 2020). At the same time, one cannot be sure that the laser meter will prove functional throughout the experiment and will not show distorted results after several trials.
Discussion
This experiment investigates a Delta Max paper airplane’s flight characteristics (range, duration). The model airplane was constructed according to the suggested instructions from a sheet of A4 paper with a density of up to 100 g/mm without additional resources, whether glue, staples, or rubber bands (PPO, 2021; RedBull, 2022). Additional paper airplane models assembled from similar materials are used for comparison — for purity, the experiment must be conducted under identical conditions to reduce distortion of the results. The primary data includes both range and flight time information for each of the five launches for the five models. However, it is not sufficient to only average these values to obtain reliable results (Luellen, 2022). On the contrary, from an experimental point of view, using a parametric one-way ANOVA test, which satisfies the experimental conditions (EZ SPSS, 2019), is suggested. The results of the inferential statistics at a given level of significance (.05) allow us to reject or accept the null hypothesis and draw conclusions about the differences in flight performance for the five paper airplane models. However, the proposed design has several limitations, discussed above, related primarily to the effects of fatigue and confidence in the correctness of long-distance and time measurements.
Conclusion
To summarize, the work has shown a robust experimental design to increase the data’s validity and provide a clear answer to the research question. Descriptive and inferential statistics manage the primary data and controlling for confounding variables helps minimize confidence bias.
References
Bohacek, P. (2021). Constructing a velocity vs. time graph. Pivot.
EZ SPSS. (2019). One Way ANOVA in SPSS, including interpretation. EZ SPSS Tutorials.
Fold’NFly. (2022).Paper airplane designs. Fold’NFly.
Luellen, E. (2018). Why averages are often wrong. TDS.
Nagwa. (2020).Lesson explainer: Measurement uncertainty and resolution. Nagwa.
Phil. (2020). How to pass 13 Plus Science: Understanding the difference between fair testing and repeated tests. OwlTutors.
PPO. (2021). How to make the world record paper airplane for distance. YouTube.
RedBull. (2022). Red Bull Paper Wings. RedBull.
Thomas, L. (2022). Confounding variables | definition, examples & controls. Scribbr.