The prices of stocks which are purchased and sold in the secondary market are mostly influenced by demand and supply. Typically, the price of stocks depends on the number of shares that are offered in relation to the demand of the stocks.
The price of the shares are often high when there are few shares in the market and if the demand of these shares is high. On the other hand, the prices of shares are low if the shares offered in the market are many. Similarly, the price of the shares becomes significantly low when demand of the shares in the market goes down. Thus, the price of shares is determined by the demand and supply of shares in the market.
Supply and Demand
The demand of shares in the stock market is determined by various factors. Sloman (2008) posits that, income, wealth, expectations, divided yield, price and returns of substitutes are the factors that influence the demand of the stocks. Sloman (2008) considers the dividend yield as the money received back by investors and is expressed as a given percentage of its price.
Many investors are attracted to purchase those stocks whose dividends are high. Equally, the prices and returns of substitutes relate to dividends as well as the market price for other corresponding stocks. Since the demand of such stocks is often high, their supply often goes down.
Subsequently, this makes the price of the stocks to increase. According to Sloman (2008), the most prevalent substitutes for investing in shares include investing in properties such as real estates. Investors are always looking for the ways to make extra money. Therefore, many investors opt to invest in properties or any other forms of investments if they consider them to be more profitable than investing in shares.
According to Boyce (2011), between 1960 and 2009 the profits for equities was higher than the profits gained from investment in property for the most part of the 20-year investment period. It was also observed that even over shorter time spans, equities have been the top-most performing asset, in 64% of five year periods, between 1960 and 2006.
Wealth represents the accrued savings and assets. Wealth that is in form of assets is easily converted into cash and invested in shares. It is important to note that houses do not have a high rate of return as compared to investments in shares. Therefore, high-rise owners often opt to sell their houses and invest that money in shares. When this occurs, it increases the demands of shares.
People’s expectations is another factor that determines the demand and prices of shares. Investors tend to buy more of those shares that they are optimistic about their future value. However, this kind of buying poses a great risk. This is because these prospects are not always true.
Sometimes, other factors which may be beyond the investors’ expectations could crop up and affect the current outstanding performances of such companies. Such issues may lessen the value of the shares (Bacchetta, Tille & Wincoop , 2010)
Share prices and their effects on businesses
The prices of shares in companies are imperative. This is because the prices of these shares are often used to depict the performance of a given company in the market. When the price of a company’s share increases, it primarily indicates that that company is performing well. Conversely, when the price of the share in a company decreases, it indicates poor performances.
Textbook Questions
If the rate of economic growth is 3% in a particular year, why are share prices likely to rise by more than 3% that year?
Strong economies have been noted to be characterized by an increase in the household income which is reflected in increased spending and investments. An economic growth of about 3% in a particular year is likely to translate to increased share prices by more than 3%. This is because a growth in the economy signifies increased per capita income.
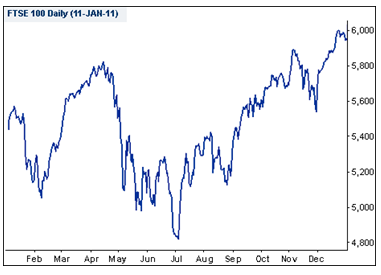
What happened to the FTSE 100 in 2010, why?

The figure above illustrates how the FTSE 100 index initially performed poorly after suffering major setbacks due to the economic recession witnessed in the year 2008-2009. According to Scott (2010), investors were reluctant to invest in shares since they could not project what would follow the financial crisis.
The financial crises of the year 2008-09 lead to the failing of many banks which impacted negatively on the value of the FTSE 100 stock market. Fletcher (2010) noted that, even by mid 2010, the performance of the FTSE 100 stock had not appreciated considerably since most investors were still under uncertainty of investing in shares. This is clearly noted by the great decrease in share prices that occurred in July.
Similarly, the value of the shares depreciated significantly in September and November. These drops were linked to large amounts of money that were given to other European countries as bail-outs (Kollewe & McDonald, 2010).
At the end of the year 2010, the value of the shares had appreciated greatly since more investors had became more optimistic about the future of shares as indicated by the raising of the overall value of the index (Scott, 2010).
Find another application of the same idea and explain why the concept is useful in the context you have chosen
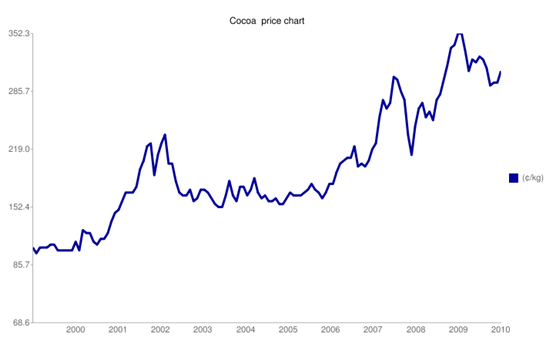
Supply and demand also determines the prices of commodities globally. For example, currently the prices of Cocoa have greatly increased due to the shortage of Cocoa which is associated with the recent civil unrest in Ivory Coast (AFN, 2011).

‘Côte d’Ivoire is among the leading producers of Cocoa in the world. Being a major supplier of the commodity, the country plays a central role in influencing the world cocoa prices. Similar concerns about the disruption of cocoa production and export during the civil war also caused New York prices to soar to a high of $2,335/tonne in October 2002.
It is observed that when cocoa is in short supply and also in high demand, its prices are often artificially inflated in a similar way to the share prices. This principle is very similar to what happens on stock markets, although the causes are usually much different.
Conclusion
The supply and demand of shares are known to be the natural determiners of the prices of shares. Nevertheless, there is a danger in that; the process is often manipulated where the prices of shares ends up being artificially inflated. This inflation is dangerous because it leads to considerable loss of investors’ money when the bubble occurs.
List of References
AAP., 2010. Wattyl accepts takeover bid from Valspar. Web.
AFN., 2011. Cote D’Ivoire and cocoa: The facts. Web.
Baccheta, P., Tille, C., & Wincoop, E., 2010. Risk panics: When markets crash for no apparent reason. Web.
Boyce, L., 2011. Investors’ love for property starts to dim. Web.
Fletcher, N., 2010. FTSE 100 dips ahead of bank stress test results. Web.
Kollewe, A., & McDonald., P. 2010. Anglo Irish Bank bailout could total €34bn. Web.
Scott, P., 2010. Where will the FTSE 100 end 2010? Web.
Sloman, J., 2008. Economics and the Business Environment, 2nd edition. New York: McGraw Hill.