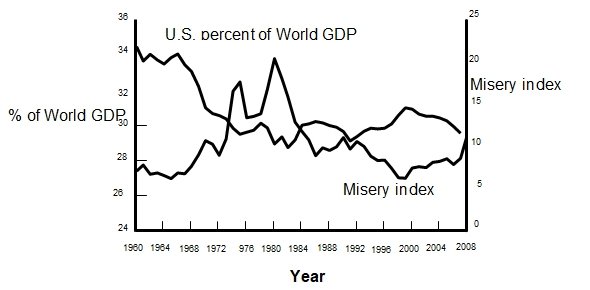
The Misery Index and the US share of the global GDP from 1960 to 2007 is as shown below (figure 1). The GDP share declined steeply in the 1970s when oil producing countries increased share portion. This trend levelled-off in the 1980s. Even with the strong emergence of the information-technology in the 1990s; the US share has been on the downward trend and lately, steeply.
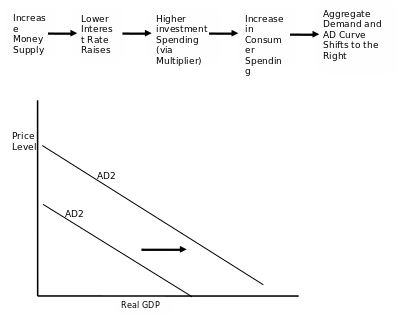
To respond to the short supply of the petroleum commodity in the 1970s; the US used expansionary policies intended to influence monetary and fiscal schemes. The expansionary intentions exceeded productivity resulting in higher inflation. This scenario popularly known as stagflation has recurred again in the recent recession.
Recent US governing regimes have adopted a protectionist approach due to increase in job losses. There has been a rising trend of back-office outsourcing propelled by the globalisation of the economy. Protectionist tendencies incldes the near sanction action reported by Rowley, against the China currency in 2011.


Globalisation of the economy results in inflation depending on the prices of inbound goods (imports) because of competition between imports and exports. This influences the pricing power of suppliers and productivity growth. With a globalised market, those supplying the US with commodities and labour face-off competition-wise because prices and wages are determined within the local and international markets.
That’s why more products found in the US markets (like textile) are from Asian countries because of lower manufacturing and labour costs. Trade competitively lowers prices; but, not inflation. In the past, US tax laws have made it cheaper to produce abroad resulting in a trade deficit.
That’s why China and India have emerged as stronger economic powers driven by trade booms. To address this, the US introduced counter measures like tax laws and declining exchange-rate. The intended effect is to transfer spending power to the rest of the world as redress for trade imbalances. Thus, there is a relative decline compared to the income in the rest of the world. This explains the US trade deficit experiences.
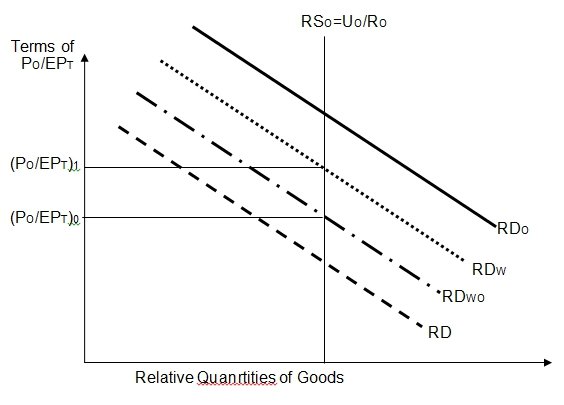
When the US spends highly, the demand curve shift outwards to RDW1; resulting in a higher value (PU/EPT) as the new equilibrium. Thus, the terms-of-trade in the US improve with a rise in exchange to (PU/EPT)1. The higher the transfer (of trade) from the global economy, the greater the increase in the US terms-of-trade.
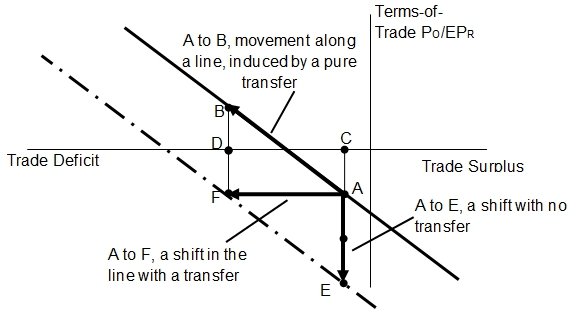
Other factors like foreign tastes and technology have an effect on terms-of-trade. Preferences for US goods result in right shift in the RDT and smaller upward change in the RDU line. When there is a negative slope, the US’ stronger terms-of-trade are associated with a broader US trade deficit (TT). This moves US-economy from A to B and the trade deficit from C to D.


Works Cited
Baily, Neil Martin and Robert, Z. Lawrence 2001, Competitiveness and the Assessment of Trade Performance. Web.
Levine, Robert A. 2009, Adjusting to Global Economic Change: The Dangerous Road Ahead. Web.
Mbemba, Augustin. “The Effects of Globalization on U.S. Monetary Policy.” International Journal of Economics and Finance. 4.6 (2012). CCSENET. Web.
Rowley, James. China Currency Message May be Stronger than Likelihood of U.S. Sanctions. 2011. Web.