Introduction
The nutritional status of an individual is affected by several variables. It is influenced by the quantity and quality of food taken. The nutritional status of an individual can fall into one of four status classes (healthy, malnourished, overweight, and obese) (Sheldon 2005). The nutritional status of an individual can be determined through nutritional assessment. There are four commonly used nutritional status assessment methods. They include anthropometric methods, clinical methods, biochemical methods, and dietary evaluation methods. The anthropometric method focuses on physical body parameters such as height, weight, skin folds, and waist circumference.
Anthropometric methods are often used for two purposes. The first one is to identify individuals and populations at risk for malnourishment. The second one is to identify individuals and populations who are malnourished. It can accurately identify undernutrition and overnutrition. Anthropometry is preferred over other nutritional assessment methods because of its specificity and sensitivity. Moreover, it is cheap and does not require specialized training. In this study, a group of students was asked to give information that would be used to estimate individual and group nutritional status.
The study investigated the influence of various variables, including place of upbringing and physical measurements, on the health status of an individual. In this study height, weight, triceps skinfold, hip circumference, waist circumference, and mid-upper arm circumference were studied. The data obtained were grouped according to sex and country of upbringing. Analyzed data was presented using tables and histograms. The results can be used to formulate ways of maintaining health (WHO Technical Report Series n.d).
The most widely used anthropometric variable is BMI, which is a function of height and weight. Body mass index is widely used by nutritionists to diagnose nutritional disorders. Several nutritional disorders can be predicted using this parameter. When used alongside waist circumference and visceral fat estimation, its accuracy is enhanced. It can be used to gauge the risk for metabolic syndromes (Korinek et al 2008).
A metabolic syndrome is a group of disorders that when occurring together, increase the risk for mortality and morbidity from some diseases. Higher BMIs indicate obesity, and according to the World Health Organization, an individual can either be moderately obese, severely obese, or very severely obese. Very severely obese individuals have a higher mortality rate when compared with members of the general population of the same age.
Materials and Methods
A group of 100 adult students was studied. The study population consisted of 63 females and 37 males aged between 19 – 45 years.
Height was measured in centimeters to one decimal place using height scales. The subjects had to stand as straight as possible during the measurement.
Weight was measured in kilograms to one decimal place using a weighing scale. The subjects had to wear light clothing and remove shoes during the actual measurement.
Mid-upper arm circumference was measured in centimeters using a nonstretch measuring tape. The subjects had to wear sleeveless clothing. The midpoint of the arm was identified and marked before taking the circumference.
The waist circumference was measured in centimeters to one decimal place using a tape measure. The measurement was taken at the level of the umbilicus.
Hip circumference was measured in centimeters to one decimal point using a non-stretch tape measure. The measurement was taken where the circumference was at its highest. The tape measure was not to be allowed to depress the skin.
The following proportions were calculated using the formulae indicated against each proportion:
BMI is calculated by dividing weight in kilograms by squared height in meters. The result is then rounded up to the nearest whole number.
BMI = Weight (kg) / Height 2 (m)2 = 60.6 / (1.63)2 =60.6 (kg) / 2.6569 (m)2 = 23 cm
The mid-arm muscle is calculated as follows:
MC = C – πS.
- Mc – Represents mid arm muscle circumference (cm)
- C – Represents mid arm circumference (cm)
- S – Represents triceps skin fold (cm)
- π (pie) = 3.142
MAMC = [ 3.142 x (24.7/10)]= 21.2 cm
Waist to Hip Ratio (WHR) is a ratio that compares waist circumference to hip circumference.
WHR → Waist / Hip → cm : cm
78 /96 = 0.81
WHR of higher than 0.9:1 for males and 0.85:1 for females is indicative of an increased risk for cardiovascular disease like stroke and congestive heart failure.
Results
Personal Data
Sex: Male
Age: 26
Height: 1.63 m
Weight: 60.6 kg
Upbringing: Developing country
Table 1: Actual body measurements in comparison with recommended standards (subject).
Table 2: The ranges and means for each measurement on the basis of sex and upbringing.
Table 3. Waist Hip Ratio Chart with varying health risk levels. (BMI calculator, n.d.)
Table 4. The number of students on the basis of sex and upbringing.
Discussion
Personal Data
The results of the subject in table 1 show that BMI is 23, which is within the normal range for acceptable weight. The WHO guidelines (n.d) state that acceptable weight is with range of BMI from 18.5 to 25 in adults. Moreover, Body mass index is a good indicator of optimum weight for height. However, it does not reflect the percentage of individual body fat (Flegal et al. 2005) and does not differentiate lean from fat mass (Romero-Corral et al 2006). Furthermore, higher body mass index indicates an increased risk for developing diabetes type 2 and cardiovascular diseases like high blood pressure, heart disease and stroke (Schneider et al. 2010). A BMI classification above 27.5 carries a greater risk for the diseases and individuals with a BMI equal to or greater than 30 are obese (Shiwaku et al., 2003).
Table 1 indicates that the subject’s triceps skin fold is 11 mm. According to the reference range in table 1.2, the highest triceps skin fold measurement indicating obesity in males is 20 mm. The medium value is 10 mm. The subject’s value is slightly above this value which means that the subject is not at risk for obesity.
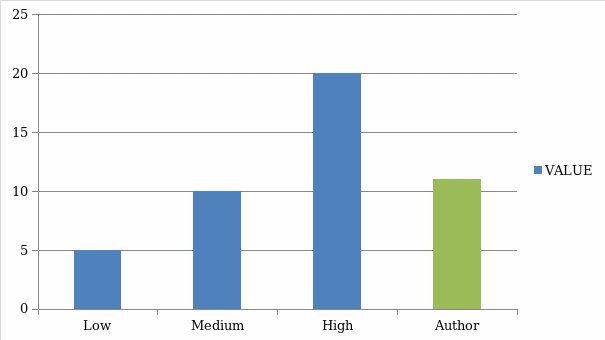
Figure 1 indicates that the author’s triceps skinfold is slightly more than (10 cm) the value regarded as medium triceps skin fold.
The standard Waist to Hip ratio indicating risk for cardiovascular disease, diabetes, and metabolic syndromes in men is 0.9: 1. Also, a value greater than 0.9: 1 is indicative of increased risk for congestive heart disease (CHD) and stroke (Romero-Corral et al, 2008). The subject’s Waist to Hip ratio (WHR) as shown in table 1 is 0.81:1. Though the author’s WHR is below the minimum value indicating risk for disease, it is sufficiently close to call for attention.
Waist circumference has been used as an indicator of risk for cardiovascular diseases and metabolic syndromes on its own (Grodner et al., 2004). The minimum waist circumference indicative of increased risk for disease is 95 cm and above this value represents a significant risk for cardiovascular disease and obesity. The subject’s waist circumference is 78, which is significantly below the minimum.
The mid-arm muscle circumference is a measure of the approximate bone and muscle mass of the arm. It can be used to estimate the amount of bone and muscle mass in comparison with adipose tissue. The subject’s mid-arm muscle circumference is 21.2 cm.
Generally, the measurements of the subject are within acceptable limits. Several factors could have contributed to this. The most important factors are diet and exercise. Although the subject does not follow any strict dietary guidelines, he tries to eat healthy food by trying as much as possible to avoid food with a high amount of fat and salt.
Exercise plays an important role in weight maintenance (William et al, 2007). It helps regulate lipids in circulation, metabolism, and expenditure of excess calories. However, the subject is not on any strict exercise routine but he relies on walking every day.
To improve the nutritional status of the subject some changes can be put in place. To begin with, the subject should participate more often in physical activity or exercise. A convenient exercise routine is recommended. This will help in maintaining the BMI in the acceptable range (Jeukendrup, Gleeson 2005). Moreover, the subject needs to improve their dietary habits. He should strive to take food rich in all classes of nutrients. The subject should avoid the intake of foods loaded with calories and salt such as fast food. It is also necessary to increase the intake of fruits and vegetables. This is because they are rich in antioxidants which promote good health. Fruits also supply vitamins that boost the immune system.
Group Data
The total number of students studied including the subject was 100. There were 37 males in total out of which 11 were from developing countries.
The number of females was 63; 28 were from industrialized countries and 35 from developing countries. The nutritional assessment revealed differences in body size between males and females. However, not much could be deduced from the data regarding industrial and developing nations. The comparison of data between groups was limited by the number of students studied. For example, the number of males who were raised in industrialized nations was 26 and those from developing countries were 11.
This represents more than double the total number of males. For a better comparison, the sample size should have been modified accordingly (Barasi 2004). On the other hand, female subjects from developing nations (35) were more than those from industrial nations (28). These numbers are close to each other and some meaningful comparisons could be done. This necessitated a comparison of the group data with that of the Australian public.
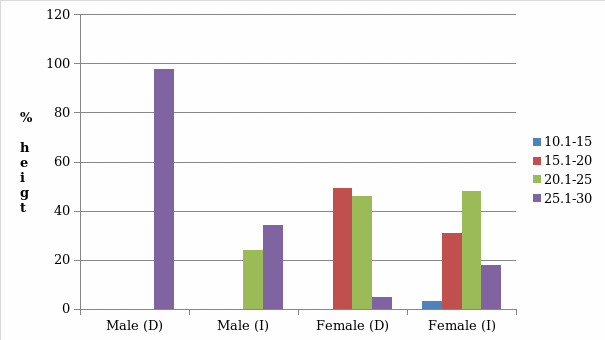
Figure 2 clearly indicates that gender and place of upbringing influence body height. Females tend to have low height and weight compared to males. Majority of the males have height that falls in between 1.62 M and 1.84 M and the influence of place of upbringing is apparent in males. Males from industrial societies tend to be taller than their counterparts from the developing countries. Some subjects raised in industrialized nations had heights above 1.85 M. On the other hand, females appeared shorter than men regardless of place of upbringing. Also, there is a significant difference in height between women raised in industrialized environments and those raised in the developing world.
Majority of women from developing world fall in to the 1.55 M to 1.64 M category. Those from industrialized countries fall into the 1.65 M to 1.74 M category. The reason behind the differences in height may relate to the genetic make up of an individual and the environment (WHO, 1995). The majority of the women raised in developed countries in the current study are from Asia especially China and Indonesia. The average height for women from china is 1.58 m (Moore, 2010) and from Indonesia is 1.470 m.
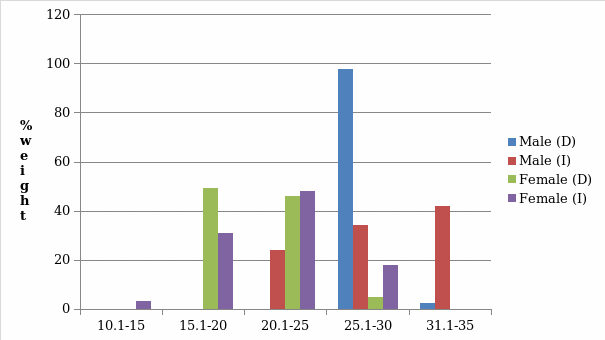
The results in figure 3 indicate that weight varies depending on country of upbringing and gender. Subjects brought up in industrial countries weighed between 60.6kg and 88 and those brought up in developing countries weighed between 54 and 138.2kg. However, figure 3 shows that majority of the males from industrial nations weigh more than 80kg. On the other hand, a number of women weighed less than 50 kg. This shows that members of the male gender tend to be heavier than females. Five males from industrial nations weighed above 90 kg. This indicates that males in the industrial nations are at an increased risk for obesity (Gadzik 2006). Most females fell into the 50kg to 60kg weight category.
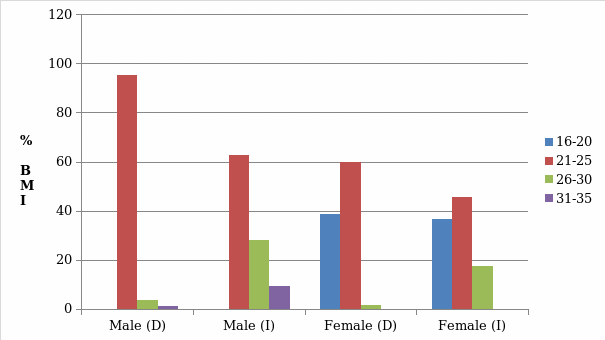
Figure 4 indicates that BMI is influenced by place of origin and gender. Some females had BMI values less than 20 while males did not. Generally males from industrial nations had higher values as compared to their counterparts from developing countries.
In order to gain a better understanding of nutritional status of each individual, body mass indices were calculated. Normal BMI ranges from 18.5 to 25 regardless of gender. Based on BMI individuals can be categorized as underweight, overweight or obese (National Institutes of Health 2007; WHO BMI Classification n.d). According to the figures obtained only one male was underweight. This represented 1% of the study population. 9% percent of males were overweight while 4 percent were obese.
These results are inconsistent with those of Australian public. This may be due to the fact that the studied population was drawn from different countries. One male student was severely overweight. He had a BMI of 45. This calls for urgent attention because people with severe obesity have more than average chance of developing type 2 diabetes, cardiovascular disorders, and other metabolic syndromes. The study did not specify how many study subjects were from Australia. This therefore does not permit appropriate comparison of data. To obtain more accurate generalizations the study should have modified to include or exclude some subjects fro the study.
The underweight women represented 10 % of the study population. This figure was shared equally among females from industrial countries and developing countries.5 percent of studied women were overweight. There were no obese women. This is not in agreement with the values given in table 1.3 for Australian public. This may have been contributed to by the same factors as mentioned above for men.
The results indicate that men are at an increased risk for obesity as compared to women. There were no obese women whereas 4 % of male students were obese. There is no concrete explanation for this, but it may have been caused by a sampling error. The number of males was significantly lower than that of females. All the studied subjects though drawn from different cultures may have a coincidental similarity to each other.
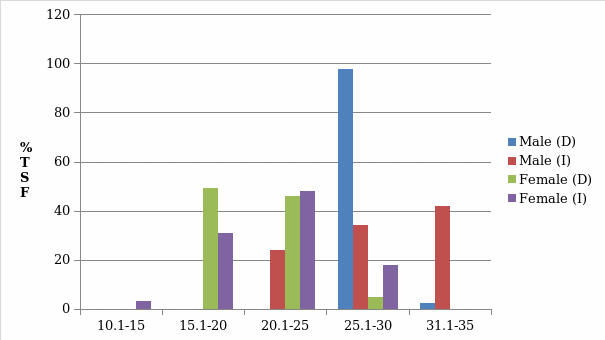
Figure 5 indicates that TSF is influenced by gender and place of upbringing. Men from developing countries tend to have higher TSF values than men from industrialized nations. Women from industrial societies had higher TSF values.
Triceps skin fold measurements indicate that 4 percent of males studied had more than 20 mm. This is the reference value indicating an increased risk for heart disease and stroke. 12% of the females have TSF greater than 20. This shows that women are at a greater risk of developing cardiovascular disease. Gender appears to exert a significant effect on the skin fold measurement. Women tend to deposit more fats under their skin into the adipose tissue.
The TSF of males tends to increase with advancing age. Those males in their thirties had higher TSF as compared to younger males. This is in agreement with the Australian public values. However, it is important to note that the students who were studied came from various countries. One result obtained from the male subjects was unusually low. The value obtained was less than 0.1cm. However, the BMI of this individual was above 30 suggesting obesity. This result could be as result of an error committed during the actual measurement or during recording.
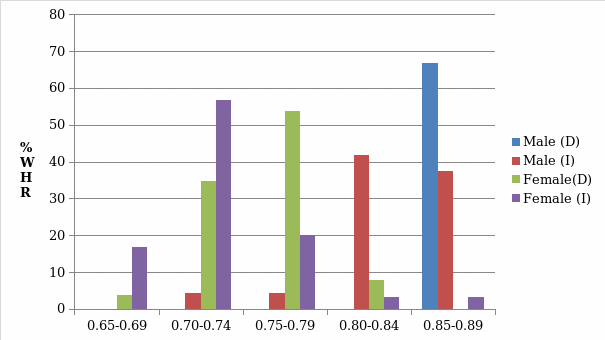
Figure 7 clearly shows a variation of WHR values depending on the place of upbringing and gender. Males from the developing world tend to have higher WHR values when compared to their counterparts from the industrialized nations. Females tend to have smaller values than males. Females from developed world have high WHR values.
Waist to hip ratio is a proportion used to predict the likelihood of obesity and cardiovascular disease. For males, a figure greater than 0.9:1 is indicative of an increased risk for disease. For females, a figure greater than 0.85:1 is suggestive of this risk. Amongst the study subjects, 3 % of both males and females crossed their respective minimums. The result shows that both, men and women in the study group are at equal risk though this is not the case.
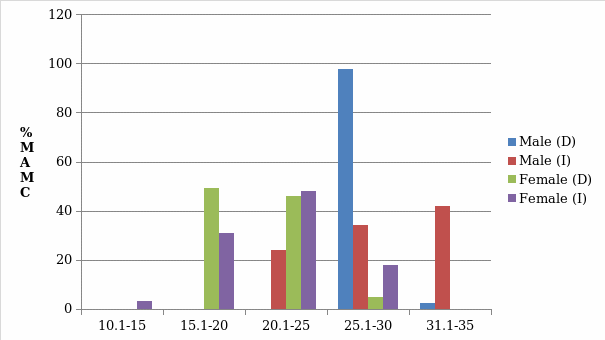
Figure 6 shows that MAMC varies with age and place of origin. Most males from developing countries had an average MAMC of between 25 and 30. Males from industrial nations had higher values. Females had smaller values as compared to men. Females from the developing world fall on the left side of the histogram.
The mid-upper arm circumference is an anthropometric parameter that is used to predict under nutrition or over nutrition. It is used to obtain important proportions, which can be used for various purposes. The mid-upper arm circumference differed amongst the two groups of subjects. Subjects from industrial nations tend to have higher mid-upper circumference as compared to those from the developing world. Men and women secrete a hormone called testosterone into circulation. However, men have higher concentrations of it. This hormone plays an important role in muscle development and response to exercise. Testosterone enables men to develop bigger muscle mass. On the other hand, women are expected to have slightly increased fat indices.
Limitations of the study as performed by the students
Limitations of the study can be divided into three categories: human error, mechanical error from measuring instruments, and error inherent in the system. Human error has various sources. Of importance is reading and recording errors. Reading calibrated instruments can suffer from parallax error. Therefore, the reported figure is several decimal points removed from the correct figure. Another potential source of human error is measuring while a subject is in heavy or inappropriate clothing. To minimize this error, students were asked to come to the laboratory in light clothing. Students were also asked to remove shoes while their weight and height were being taken.
Mechanical error results from faulty instruments. Equipment may be damaged and or are not well set before use. To minimize this error, students were asked to ensure that weighing scales and tape measures were in good working condition before they did the study. Another potential limitation of the study is the sample size or the study population. The study subjects were drawn from different countries. This may affect the quality of generalizations that can be generated from the study.
Conclusion
Nutritional assessment is performed to determine the present and past nutritional status of an individual or a group of people. There are several nutritional assessment methods. The methods include anthropometry, biochemical tests, and clinical assessment. In this experiment, anthropometry was used. Anthropometric measures can be used to judge an individual’s present and future risk for disease.
The data collected from the author indicate that the author is in fairly good health. The author has a BMI of 23, which though within the normal range should be watched keenly. So as not to increase the risk of adding weight the author should consider adopting a strict exercise routine. The author should also strive to eat a balanced diet whenever possible. Foods that are loaded with too many calories and fat should be avoided. Another way of improving body weight and overall health is eating enough fruits and vegetables. These food materials are rich in vitamins and antioxidants that aid in the development and maintenance of the immune system.
The group data were compared to those of the Australian public. The results reveal that body size is influenced by gender and place of upbringing to a large extent. Males tend to be larger than females. TSF of females is also higher as compared to that of males of the same age. However, as men grow older and move into their thirties, they tend to acquire increased body size, especially TSF.
Therefore, the results showed that older males are at increased risk for cardiovascular disease like stroke. With regards to BMI, most students recorded a healthy weight. However, one male student had a BMI of 45. This falls into the severe obesity category. States of unhealthy weight are often the result of a sedentary lifestyle and poor eating habits. To maintain healthy weight students should strive to eat correctly and adopt exercise routines convenient to them. One unusually low TSF result was recorded. This could have arisen due to errors committed during measurement or recording.
Anthropometric measurements were found to be reliable in predicting the future health status of an individual. A great problem facing these measurements is their limited use in different populations. Different populations have different reference values for these measurements.
A major disadvantage of anthropometry measurements is their limited application to all body compartments. Anthropometry does not measure the amount of fluid compartment of the body. The values obtained are relative figures and not absolute. Some nutritionists have recommended that they should not be used on their own as diagnostic tools in clinical settings. These measurements are prone to human error during measurement.
Overall recommendations
Based on the results obtained, a number of recommendations can be made. First to improve the quality of results, a larger population should be studied. A large population permits generalization of results. The subjects should also be well balanced among cultures. In the current study the proportion of those from industrialized nations was higher. General dietary recommendations based on the results include reducing consumption of foods that are not well balanced. Exercise should also be included in one’s daily routine. The number of exercise sessions per week should be increased as tolerated.
References
Barasi, E 2004, Human Nutrition – a health perspective.
BMI calculator n.d. Web.
Flegal, K., Graubard, B, Williamson, F, Gail, M 2005, “Excess Deaths Associated with Underweight, Overweight, and Obesity”, JAMA, vol. 293 no. 15, pp. 1861–7.
Gadzik, J 2006, ‘How much should I weigh?’ Quetelet’s equation, upper weight limits, and BMI prime”, Connecticut Medicine, vol. 70 no. 2, pp. 81–83.
Grodner, M; Long, S; DeYoung, S 2004, “Nutrition in Patient Care”, Foundations and clinical applications of nutrition: a nursing approach 3rd edn, Elsevier Health Sciences, Amsterdam, pp. 406–407.
Jeukendrup, A. & Gleeson, M 2005, “Human Kinetics: An Introduction to Energy Production and Performance”, Sports Nutrition.
National Institutes of Health, “Aim for a Healthy Weight: Assess your Risk”. 2007. Web.
Romero-Corral et al, 2006, “Association of bodyweight with total mortality and with cardiovascular events in coronary artery disease: A systematic review of cohort studies”, The Lancet 368 (9536), pp. 666–678. Web.
Romero-Corral, A; Somers, V K; Sierra-Johnson, J; Thomas, R J; Collazo-Clavell, M L; Korinek, J; Allison, T G; Batsis, J A et al 2008, “Accuracy of body mass index in diagnosing obesity in the adult general population”, International Journal of Obesity, no. 32, vol. 6, pp. 959–66. Web.
Schneider, H. et al. 2010, “The Predictive Value of Different Measures of Obesity for Incident Cardiovascular Events and Mortality”, Journal of Clinical Endocrinology & Metabolism, vol. 95, no. 4, pp. 1777–85. Web.
Sheldon, L 2005, “Oliver blames ‘obesity mafia’ for American weight scare”, The Dartmouth. Web.
Shiwaku, K; Anuurad, E; Enkhmaa, B; Nogi, A; Kitajima, K; Shimono, K; Yamane, Y; Oyunsuren, T 2003, “Overweight Japanese with body mass indexes of 23.0–24.9 have higher risks for obesity-associated disorders: A comparison of Japanese and Mongolians” International Journal of Obesity, vol. 28, no. 1, pp. 152–158.
William D. McArdle, Frank I. Katch, and Victor L. Katch 2007, “Exercise physiology: energy, nutrition, and human performance” in Exercise Physiology 6th edn, Lippincott Williams & Wilkins, Philadelphia, pp. 794–795.
World health organization, 1995, Physical Status: The Use and Interpretation of Anthropometry”, WHO Technical Report Series vol. 854, no. 9.
World Health Organization. “BMI Classification”. Web.