Introduction
In the course of mathematical modeling with data, I have learned how to apply different statistical methods in data analysis and making the appropriate interpretation. To meet the course requirements, I have to undertake data analysis using different data types, present results, and make relevant interpretations. In this project, the first type of data is about the total population and the working-age population of people in five of the G8 countries. The second type of data is about the life expectancy of people at birth and 60 years in different geographical regions globally. The third type of data is about the gross domestic product of different countries and regions. The analyses of these data types allowed the application of descriptive statistics such as mean, standard deviation, median, range, variance, minimum, maximum, kurtosis, and skewness. Moreover, the data allowed the performance of inferential analyses using correlation and regression to determine the nature and the strength of relationships. The project presented data using line graphs, a scatter plot and a bar graph.
The objective of the Project
The main objective of the project is to apply mathematical modeling techniques in data analysis, present results using tables and charts, and discuss results to provide meaningful information.
Search of Data
The data used in the project was selected from online databases. Since there are numerous online databases, the data was searched in related databases to provide meaningful data and results. Moreover, since the available data is huge, the project selected relevant portions of the data, which are in line with the topic and theme of the project. Therefore, I searched data about population, health, and economics from different databases. I searched data of the total population and the working-age population from the World Bank’s database (World Bank, 2017a). I selected these forms of data to depict trends of the total population and the working-age population in five of the G8 countries. I also selected data of life expectancy at birth and 60 years of people in different regions (World Health Organization, 2017). The data is appropriate for the project because it highlights trends in life expectancy at birth and 60 years in different regions, and their relationship is relevant in predicting the life expectancy of people in the various regions. I selected the data of GDP (2015) from the World Bank’s database (World Bank, 2017b).
Analysis of Data
The project employed descriptive statistics involving measures of central tendency and dispersion in the presentation of patterns and trends of data in tabular form (Downey, 2015). In measures of central tendency, the project used median and mode, while in measures of dispersion, the study used the standard deviation, variance, minimum, maximum, and range. The project also used skewness and kurtosis in the analysis of the distribution of data (Holcomb, 2016). The project also presented the results using line graphs, a scatter plot and a bar graph. The project used correlation and regression analyses for Field (2013) holds that they determine the nature and strength of the relationship between variables.
Results and Discussion
This section of the project presented results, analyzed them and discussed them comprehensively to provide a clear interpretation. In the first section, the project presented and discussed results of the total population and the working-age population in different countries. Subsequently, the project presented the results of the life expectancy at birth and 60 years and discussed their trends in various countries across the world. Finally, the project presented results of GDP and discussed their trends in various countries and regions of the world.
Total Population and Working-Age Population
Figure 1 below shows trends of the total population from 1960 to 2015 in five of the G8 countries distributed in North America, Europe, and Asia. These countries are Canada, the United States, the United Kingdom, Japan, and Russia. Over decades (1960-2015), the population size of each country has grown and ranked relatively constant in the position based on the size of the population. In essence, over the decades, the United States has been leading in the size of the population, followed by Russia, Japan, the United Kingdom, and Canada. The figure shows that the population of the United States has been increasing exponentially from approximately 180 million in 1960 to about 321 million in 2015.
The population of Russia has increased exponentially from about 119 million in 1960 to approximately 148 million in 1990. However, the population growth remained stagnant at about 148 million between 1990 to 2000, where the total population gradually declined to about 144 million in 2015. In comparison, Japan’s population has increased gradually from about 92 million in 1960 to about 126 million in 2015. The population of the United Kingdom has experienced the lowest growth because it has gradually increased from about 52 million in 1960 to about 65 million in 2015. From 1960 to 2015, the population of Canada has doubled, for it has increased from approximately 17 million to roughly 35 million. Therefore, the line graph depicts that the United States, Japan, Russia, the United Kingdom, and Canada have different population sizes and varied growth rates.
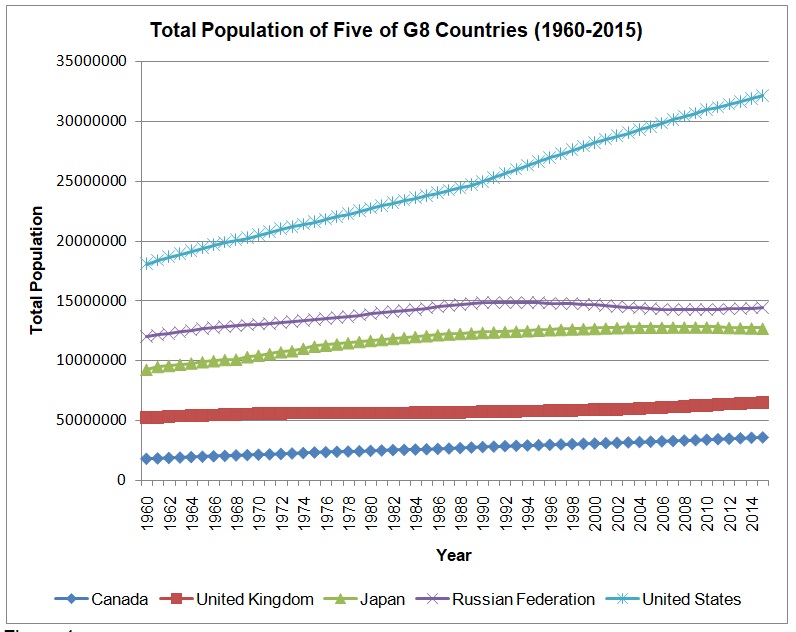
Table 1 shows the descriptive statistics of the proportion of the working-age population in Canada, the United Kingdom, Japan, Russia, and the United States. The United Kingdom is leading in the average proportion of the working-age population (M = 54.71, SD = 2.75) followed by the United States (M = 54.22, SD = 5.93), Canada (M = 51.60, SD = 8.91), Japan (M = 48.87, SD = 5.18), and Russia (M = 47.73, SD = 5.93). Moreover, Canada is the most variable because it has a range of 27.15%, with the maximum and the minimum proportions of the working-age population being 71.04% and 43.89%, respectively. The United Kingdom is the least variable because it has a range of 9.37%, in which the maximum and minimum proportions of the working-age population being 60.49% and 51.12% correspondingly. Japan has the maximum and minimum proportions of the working-age population being 64.47% and 43.02% in that order, which forms a range of 21.45%. The range of the working-age population of Russia is 19.63%, with the maximum and minimum proportions being 58.43% and 38.80% correspondingly. The range of the working-age population is 18.56%, with the maximum proportion being 67.13% and the minimum proportion being 48.57%. Thus, Table 1 shows that proportions of the working-age population vary according to mean, means, standard deviation, range, maximum score, and minimum score.
Table 1. Descriptive Statistics of the Proportion of Working-Age Population.
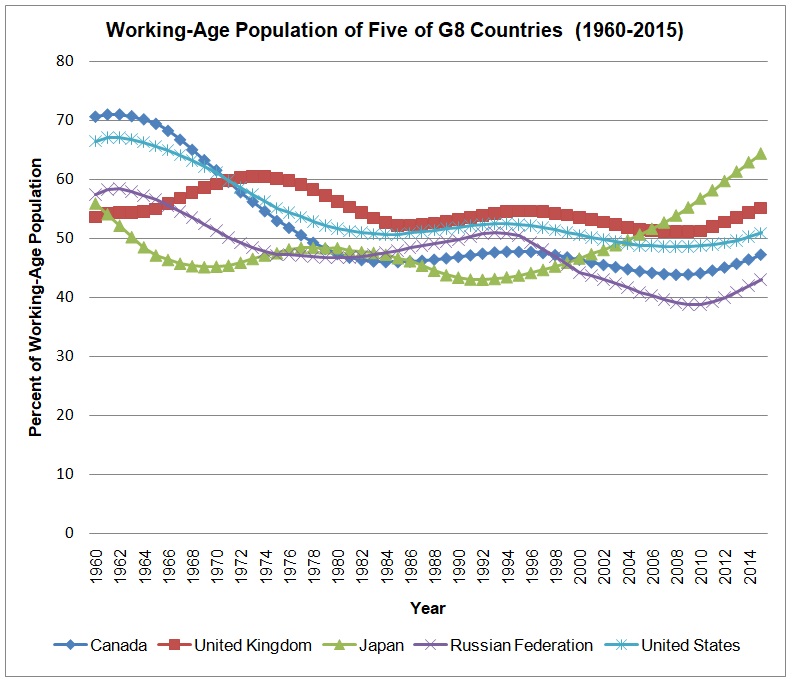
Figure 2 above shows trends of the working-age population of Canada, the United Kingdom, Japan, Russia, and the United States. The figure shows that the proportion of the working-age population has been fluctuating from 1960 to 2015. The working-age population has attained the highest proportion of about 71% and the lowest proportion of about 43%. In 1960, Canada had the highest proportion of the working-age population, which has gradually declined to about 47% in 2015. In the same manner, the working-age population of the United States has decreased gradually from about 66% in 1960 to roughly 50% in 2015. The working-age population of the United Kingdom has fluctuated with time and remained constant because it was about 53% in 1960 and has reached about 55% in 2015. The working-age population of Russia has declined from about 57% in 1960 to about 43% in 2015. In comparison with other countries, Japan is the only country in which the proportion of the working-age population has increased exponentially from 57% in 1960 to 64% in 2015. Comparatively, in 2015, Japan was leading in the proportion of the working-age population (64%), followed by the United Kingdom (55%), the United States (50%), Canada (47%), and Russia (43%).
Life Expectancy at Birth and 60 Years
The descriptive statistics of life expectancy at birth show that different regions of the world have varied levels of life expectancy. The region with the lowest life expectancy is the African region (M = 55.05, SD = 3.20), with the range of 9.37 and the maximum and the minimum values being 50.64 and 60.01, respectively. The Americas’ region is leading with the highest life expectancy at birth (M = 74.41, SD =1.00) with the narrowest range of 3.126 and the minimum and maximum values as 73.72 and 76.89 correspondingly. The European region (M = 74.41, SD = 1.53) and the Western Pacific region (M = 74.86, SD = 1.21) have almost the same levels of life expectancy at birth. The European region has a range of 4.26 with the maximum and the minimum values as 76.52 and 72.26, whereas the Western Pacific region has a range of 4.05 and the maximum and minimum values as 71.39 and 66.36, respectively. The region of South-East Asia (M = 66.27, SD = 1.76) has a lower level of life expectancy at birth than the global region (M = 68.91, SD = 1.65). The region of South-East Asia has a range of 5.46 while the global region has a range of 5.03.
Table 2. Descriptive Statistics of Life Expectancy at Birth.
Figure 3 depicts trends in life expectancy at birth of different regions of the world, namely, Africa, Americas, Europe, South-East Asia, Western Pacific, and global region. From the figure, it is evident that the Americas, Europe, and Western Pacific are regions that have similar trends of life expectancy at birth, which are higher than the global trend. The life expectancy of South-East Asia is less than the global trend but closely follows it. The African region has the lowest level of life expectancy at birth, which is significantly less than the global life expectancy at birth.
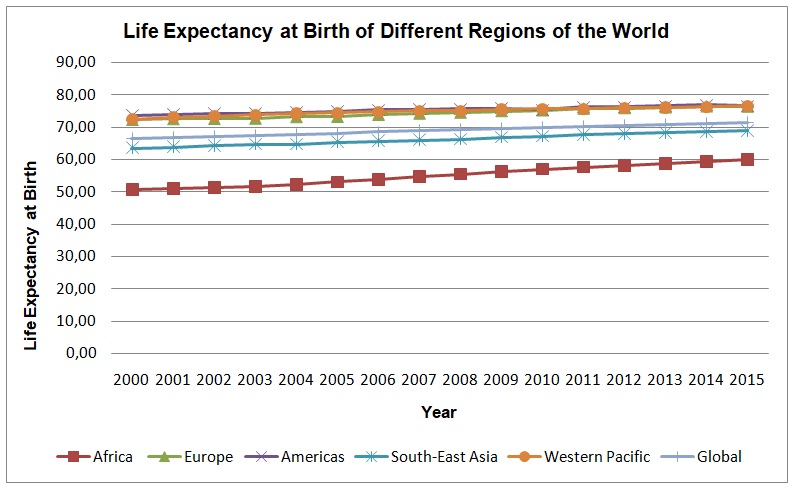
Table 3 shows descriptive statistics of life expectancy at 60 people in different regions of the worlds, namely, Africa, Europe, Americas, Western Pacific, South-East Asia, and global region. People in the region of Africa have the lowest life expectancy at 60 (M = 15.79, SD = 0.48), with the range of 1.38 and the maximum and the minimum values being 16.51 and 15.13, respectively. In contrast, America has the highest life expectancy at 60 (M = 21.88, SD = 2.46) with the range of 1.90 and the maximum and minimum values being 20.90 and 22.81 correspondingly. The European region (M = 20.79, SD = 0.48) and the Western Pacific region (M = 20.19, SD = 0.46) have nearly the same life expectancy at 60. The life expectancies of people in the European region and the Western region are higher than that of the global region (M = 19.55, SD = 0.52). The life expectancy of people in South-East Asia (M = 17.26, SD = 0.42) is lower than that of the global region.
Table 3. Descriptive Statistics of Life Expectancy at 60.
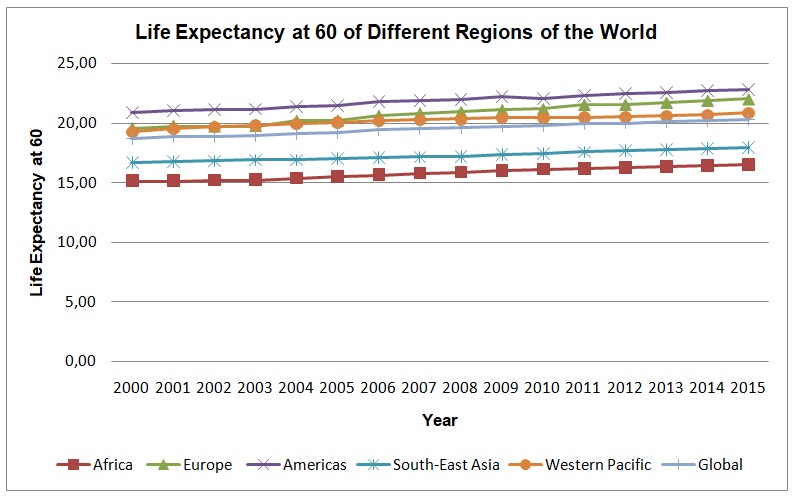
Figure 4 above demonstrates how the trends of life expectancy varied from 2000 to 2015 in various regions of the world. People in the Americas’ region have the highest level of life expectancy at 60 followed by people in the European region and the Western Pacific region. Fundamentally, people in the Americas’ region, the European region, and the Western Pacific region have a higher level of life expectancy at 60 than the global population. People in South-East Asia and Africa have a lower level of life expectancy at 60 than the global population.
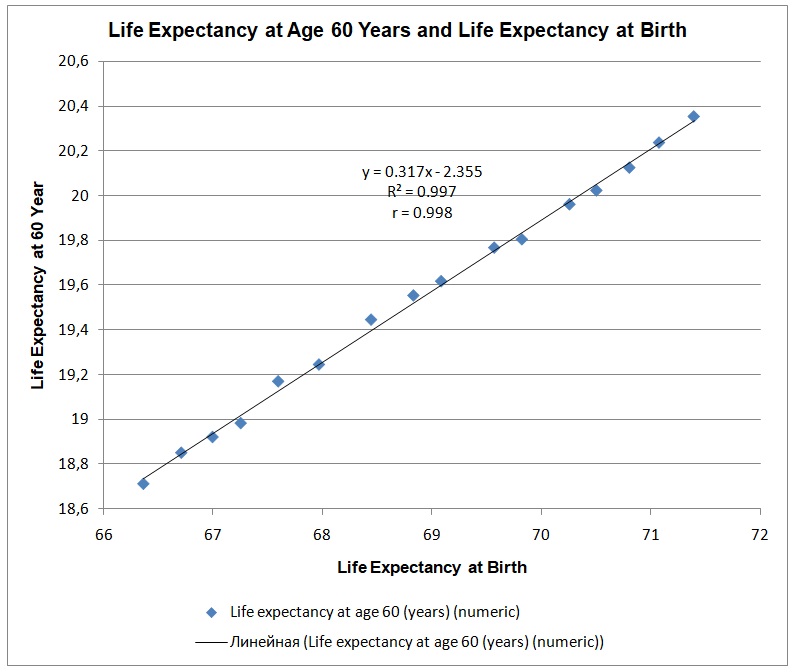
Figure 5 is the scatter plot showing the strength and the nature of relationships between life expectancy at birth and life expectancy at six years. The trend line shows that there is a very strong positive relationship between life expectancy at birth and life expectancy at 60 years (r = 0.998). The R-square of the regression analysis is 0.997, which means that life expectancy at birth explains 99.7% of the variation in the life expectancy at 60 years. As the life expectancy at birth accounts for a significant part of the variation in the life expectancy at 60 years, it implies that one can use the regression model in predicting the life expectancy of people in various regions across the world. The trend line has a regression equation: y = 0.317x -2.355, which effectively predicts the life expectancy of individuals at 60 years. For instance, if a person has a life expectancy of 40 years at birth, life expectancy at 60 years would be ten years (y = 0.317*40 – 2.355).
Gross Domestic Product 2015
According to the data collected in 2015 among 199 countries by the World Bank, GDP varies from one country to another. The descriptive statistics (Table 4) show that the mean GDP is about $368 billion with the standard deviation of about $1.578 trillion (M = $368,822E6, SD = $1,578,535E6). The range of GPD is $18,036,615E6 with the maximum and the minimum GPP values being $18,036,648E6 and $32E6 respectively. The distribution of GDP is skewed and kurtotic because it has a positive skew of $8.9E6 and a positive kurtosis of $89.9E6.
Table 4. Descriptive Statistics of GDP.
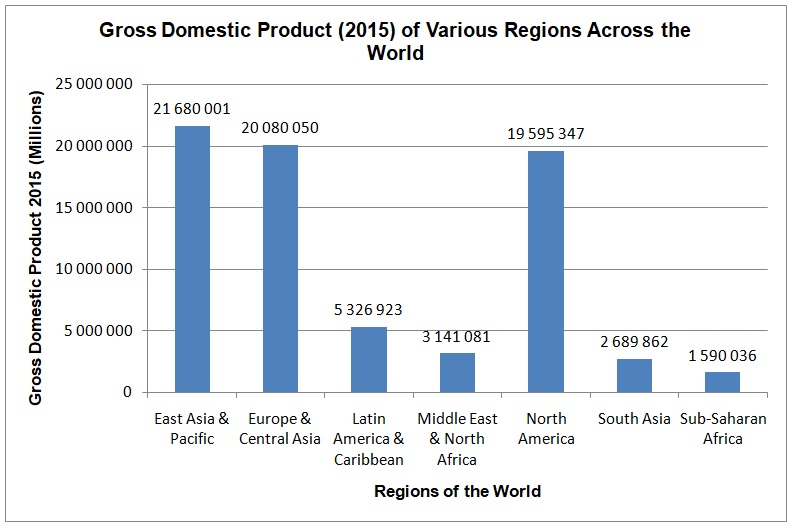
Moreover, the data collected by the World Bank in 2015 shows that GDP also varies according to various regions of the world such as East Asia, Europe & Central Asia, Latin America & Caribbean, Middle East, and North Africa, North America, South Asia, and Sub-Saharan Africa. Figure 6 shows that the East Asia & Pacific region is leading with a GDP of $21,680,001E6 followed by Europe & Central Asia with a GDP of $20,080,050E6 and North America with A GDP of $19,595,347E6. The Sub-Saharan region has the least GDP of $1,590,036E6 while South Asia ranks second last with a GDP of $2,689,862E6. The region of Latin American & the Caribbean has a GDP of $5,326,923E6, while the region of the Middle East & North Africa follows closely with a GDP of $3,141,081E6.
Conclusion
The analysis, interpretation, and presentation of data revealed important trends in each type of data that the project used in statistical modeling. The results of the total population show that is leading in the size the rate of population growth as the total population in 2015 was about 321 million. Russia, Japan, and the United Kingdom followed with about 144 million, 126 million, and 65 million, respectively. Canada is the country with the least population of about 35 million in 2015. Regarding the working-age population, Japan is leading with about 64%, followed by the United Kingdom at 55%, the United States at 50%, Canada at 47%, and Russia at the lowest at 43%. The data of the life expectancy at birth reveals that people in the Americas region, the European region, and the Western Pacific region have life expectancy levels of about 75.4, 74.4, and 74.8, respectively, which are greater than that of the global region (68.9).
The South-East Asia region has a life expectancy at birth of 66.3, while the African region has the lowest life expectancy of 55. In the aspect of life expectancy at 60 years, Americas is leading followed by Europe, Western Pacific, South-East Asia, and Africa. The Scatter plot shows that life expectancy at birth is a strong predictor (r = 0.998), for it explains 99.7% of the variation in life expectancy at 60 years. The analysis of GPD shows that it varies from one region to another across the world. The East Asia & Pacific region has the highest GDP of $21,680,001E6, while the Sub-Saharan region has the lowest GDP of $1,590,036E6.
References
Downey, A. (2015). Think stats: Exploratory data analysis. New York, NY: O’Reilly Media.
Field, A. (2013). Discovering statistics using IBM SPSS statistics. New York, NY: Cengage Learning.
Holcomb, C. (2016). Fundamentals of descriptive statistics. New York, NY: Taylor & Francis.
World Bank. (2017a). Population.Web.
World Bank. (2017b). GDP ranking.Web.
World Health Organization. (2016). Life expectancy data by WHO region. Web.