Introduction
Health and wellbeing among youth are important not only for individual happiness but the growth and development of the society and the nation as well (AIHW, 2011). Research and studies note that health and wellbeing of young people results in them becoming responsible citizens of society due to better educational outcomes, healthy lifestyles in adulthood and good parenting styles (Muir et al. 2009).
Health is a very broad term which includes all aspects of an individual’s well being and not just an absence of disease. Eckersley (2008) uses health and wellbeing as exchangeable terms and defines health as the “degree to which people enjoy the living conditions (social, economic, cultural and environmental) that are conducive to total health and wellbeing (physical, mental, social and spiritual)”.
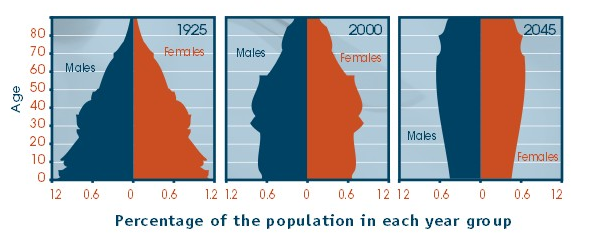
The health and wellbeing of the Australian youth is important to the Australian government not only because the youth of a nation are its future, but also because the Australian population is an ageing one (Ragg, 2007). In a report by the Australian state and territory ministers, Ragg (2007) found that the the percentage of newborn babies in Australia is reducing each year.
With the percentage of older adults on the rise, Australia is no more a country of the young, but a land where the majority of the people belong to the middle age group. As such, it has become doubly important to ensure that the Australian youth are healthy and happy, socially, psychologically and economically.
Researchers have been concerned about the health and wellbeing of young Australian and have conducted several studies to explore the dimensions of health and wellbeing among the young people of Australia (Eckersley 2008; Eckersley et al., 2006; Glover et al., 1998).
In order to bring about positive health changes in the Australian youth community, it is imperative to understand the causes and effects of health and wellbeing from their perspective. This paper contributes to this goal by identifying these perspectives of health and wellbeing among young Australians.
The research explores the way in which the youth of Australia defines the notion of good health and consequent wellbeing, and the effects of this wellbeing on the young people of Australian society. The paper focuses on some important factors which have a negative impact on health and wellbeing of the youth, such as mental health and social networking.
Literature Review
Youth researchers describe wellbeing holistically rather than individually, in terms of their needs, requirements, lifestyle and overall quality of life (White and Wyn, 2007). Youth researchers evaluate youth wellbeing in terms of their physical and mental health, financial prosperity, social inclusion, networking and support, individuality and spirituality (White and Wyn, 2007).
Researchers have pointed out the importance of social processes (for instance homelessness which fails to provide a safe home environment) as influential factors determining the wellbeing of youth (Bourke & Geldens, 2007). In their study, Bourke & Geldens (2007) surveyed the dimensions of wellbeing in young adults.
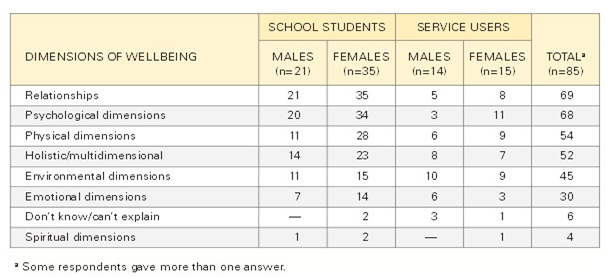
Data from their research revealed that the youth laid emphasis on factors such as the self, personal goals, living and working environments, physical and mental health and emotions as crucial indicators of wellbeing.
As indicated in the table below the participants have given high rankings to social relationships and friendships. They gave high ratings to relationships with friends, family, community members, and peers as all of these provide them with a secure sense of belonging.
The study reaffirms the importance of the social dimension in young people who lay great emphasis on social acceptance and relationships as being crucial to their sense of wellbeing (Bourke & Geldens, 2007).

A detailed study by Easthope & White (2006) analyzed the impact of social relationships on the health and wellbeing of young people. The researchers interviewed adolescents between the ages of 11 years and 18 years, in rural and urban settings. The results of the qualitative interview of these young individuals revealed that their concepts of health relative to a good diet were clear.
However, behaviors such as sports and health activities were heavily linked with friendships and social relationships. Even bad health behaviors such as smoking and drug abuse were impacted by social relationships with friends. The research provides a comprehensive outlook on the perceptions of health and wellbeing from the adolescent perspective.
Eckersley (2008) states that mental health disorders are the third largest most important contributors to disease. Nearly 50% of the Australian youth are affected by mental health disorders, mainly anxiety and depression (Begg et al., 2007). There has been a steady rise in the Australian populace reported with mental health issues.
Mental disorders have a critical impact on the wellbeing and functioning of individuals due to their disabling effect and have become a serious cause of concern for the Australian youth (Slade et al., 2007). Nearly 45% of the entire Australian population have been diagnosed with some or other mental health problem once in a lifetime; the percentage of the youth with disorders is particularly high.
Research findings of a National Australian Survey to find the state of mental health and wellbeing of Australian residents highlighted some astounding results related to the youth (Slade et al., 2009). The study noted that 22.8% of young men between the ages of 16 and 24 had a mental health issue.
However, only 13.2% took professional help. Results from the study affirmed the high prevalence of mental health problems in Australians, with nearly half of the population meeting the criteria for some or other mental disorder.
Social media plays an important aspect in the lives of the youth today. It is now clear that the young people lay great emphasis on social inclusion as an important factor in health and wellbeing (Bourke & Geldens, 2007; Eckersley 2008; White and Wyn, 2007). Research and studies confirm the harmful effects of media on the youth due to health issues such as obesity, depression and aggression (Strasburger 2010).
Since social relationships and friends play such an important role in the lives of young people, a study which does not take into account the impact of social networking media such as Facebook would be incomplete. In a country where the percentage of the youth is shrinking and mental health disease rates are high, it is important to consider the impact of popular social networking sites like Facebook on the Australian youth.
In an article about the role of social media on health and wellbeing, Charmaine Yabsley (n.d.) points to the negative impact of social media and networking sites such as Facebook. She states that Australia is one of the highest ranking nations with nearly 80% of the population online.
She points to the negative impact of sites like Facebook which are believed to be causing new mental disorders like ‘Facebook depression’ in troubled adolescents. The Australian Institute of Health and Welfare (2011) confirms the negative effects of social networking sites like Facebook and YouTube which could be misused for online fraud, bullying and pornography.
Yabsley (n.d.) asserts that not only does social media negatively affect mental health but also causes serious physical health problems. With reduced physical activity, social media can cause diseases like obesity, cardiovascular diseases, diabetes and depression due to an inactive life lacking physical activity.
Discussion
Eckersley (2008) candidly declares that “fundamental social, cultural, economic and environmental changes in Australia and other Western societies are impacting adversely on young people’s health and wellbeing.” Evidence suggests that social and psychological factors play a crucial role in the health and wellbeing of young adults (Bourke & Geldens, 2007; Eckersley, 2008; Slade et al., 2009).
Other studies also indicate that young individuals who face problems in transitioning from adolescence to adulthood could face difficulties in later life as well. Muir et al. (2009), affirm the strong relationship between behaviors during youth and those in later life.
Moreover, the Australian population is an ageing one (Ragg, 2007). With a serious decline in new births, the ration of youth to middle aged adults has drastically reduced. The image below indicates the rates of declining young people in Australia (Ragg, 2007).

Considering that the youth of any country is central to its development and progress, the health and wellbeing of the Australian youth are of prime importance to the Australian government (AIHW, 2011).
It is the government’s job to ensure that the Australian youth gets the best possible conditions for a good start in life through policy initiatives and early intervention methods which will enhance their health and wellbeing and help them become promising future citizens.
Conclusion
The youth of a country plays an important role in determining its future. Health and wellbeing increase the prospects of young people becoming good and responsible citizens of a country.
With the ageing Australian populace, the Australian government bears a huge responsibility of developing programs and policies to ensure its health and wellbeing on all levels, physical, social and psychological. A clear understanding of the causes and effects of health and wellbeing will help in achieving the goal of creating a better society with responsible mature and happy adults.
Reference List
Australian Institute of Health and Welfare (AIHW) 2011, Young Australians: their health and wellbeing 2011, Cat. No. PHE 140. AIHW, Canberra.
Begg S, Vos T, Barker B, Stevenson C, Stanley L & Lopez A 2007. The burden of disease and injury in Australia, 2003. AIHW, Canberra.
Bourke, L & Geldens, P 2007, ‘What does wellbeing mean? Perspectives of wellbeing among young people and youth workers in rural Victoria ‘, Youth Studies Australia, vol. 26, no. 1, pp. 41-49.
Yabsley, C n.d., Social media and its impact on health and wellbeing. Web.
Eckersley, R 2008, Never better – or getting worse? The health and wellbeing of young Australians. Australia 21 Ltd, Canberra.
Eckersley, R, Wierenga, A, & Wyn, J 2006, ‘Success and wellbeing: A preview of the Australia 21 report on young people’s wellbeing’, Youth Studies Australia, vol. 25, no.1, pp.10-18.
Easthope, G & White, R 2006, ‘Health & Wellbeing: How Do Young People See These Concepts?’, Youth Studies Australia, vol. 25, no. 1, pp. 42-49.
Glover, S, Burns, J, Butler, H & Patton, G 1998, ‘Social environments and the emotional wellbeing of young people’, Family Matters, vol. 49, pp. 11-16.
Muir, K, Mullan, K, Powell, A, Flaxman, S, Thompson, D & Griffiths, M. 2009. State of Australia’s young people: a report on the social, economic, health and family lives of young people. Department of Education, Employment and Workplace Relations and the Social Policy Research Centre, University of New South Wales, Canberra.
Ragg M, editor 2007, ‘Caring for our health? A report card on the Australian Government’s performance on health care’. Web.
Slade, T, Johnston, A, Oakley, Browne, M A, Andrews, G, Whiteford, H 2009, ‘2007 National Survey of Mental Health and Wellbeing: methods and key findings’, Aust N Z J Psychiatry, vol. 43 no. 7, pp. 594-605.
Strasburger, V 2010, ‘Children, adolescents, and the media: seven key issues’, Pediatric Annals vol. 39, no. 9, pp. 556–65.
White, R & Wyn, J. 2004, Youth and society: Exploring the social dynamics of youth experience, Oxford University Press, Melbourne