Introduction
Peta-Marron’s expansion to Australia is a business process that requires a detailed analysis of the financial situation of the market and company. This financial report identifies whether a new branch in a different country will be profitable. The company’s main competitors in the Australian market are Leda Nutrition and Byron Bay Cookie biscuit-producing companies.
The data used in the financial report such as biscuit prices are retrieved from the competitors’ official websites. The corporate structure that Peta-Marron should adapt is geographical organizational structure and the location of the office has been decided to be Melbourne city. The set-up cost for start-ups estimated by Caramela (2022) is 500,000 US dollars which will be enough for six months.
According to Peta-Marron start-up cost analysis, completed by our group, it will cost the company $491,884 to open the office in Australia. The cost includes utility payments, cost of incorporation in Australia of $600, cost of raw materials, and lease or hire purchase payments. The following pages will discuss projected financial statements of the company, to be precise P&L, Balance Sheet, Cash-flow, and Break-even Point analysis.
Why is financial section needed?
The financials sections might be the most important part of the report because often businesspeople prefer looking at numbers rather than words. Investors are usually interested in financial projections when deciding whether to invest or not. Similarly, the heads of the departments and CEO are often interested in looking at numbers in the financial section when making a decision regarding expansion.
The numbers matter because the most important thing in doing a business is making a profit to maintain the company on the market. Projecting financial statements also helps minimize the risks and increase potential profit for the company when the decision for expansion or investing is made.
The link between financial projections and previous sections
The financial part regulates the potential costs and earnings, which means that marketing, strategy, and SDGs that were discussed in previous sections depend on how spending will be distributed between different departments. And hence, the financial statements are necessary to project the growth strategy because if numbers show that expansion is non-profitable, the strategy will not be necessary. All parts of any business are interconnected, which is why it is essential to understand all of them.
Projected Financial Statement
Profit & Loss
This part consists of two major calculations – Profit and Loss table and the Balance Sheet table. The first one represents possible earnings and spending for five years, whereas the second one represents the company’s assets for the given period of time. Both tables are based on projections of the company regarding expansion in Australia. The average price of products is taken as $6 because this is the average price at which major competitors Leda Nutrition and Byron Bay Cookie companies sell cookies.
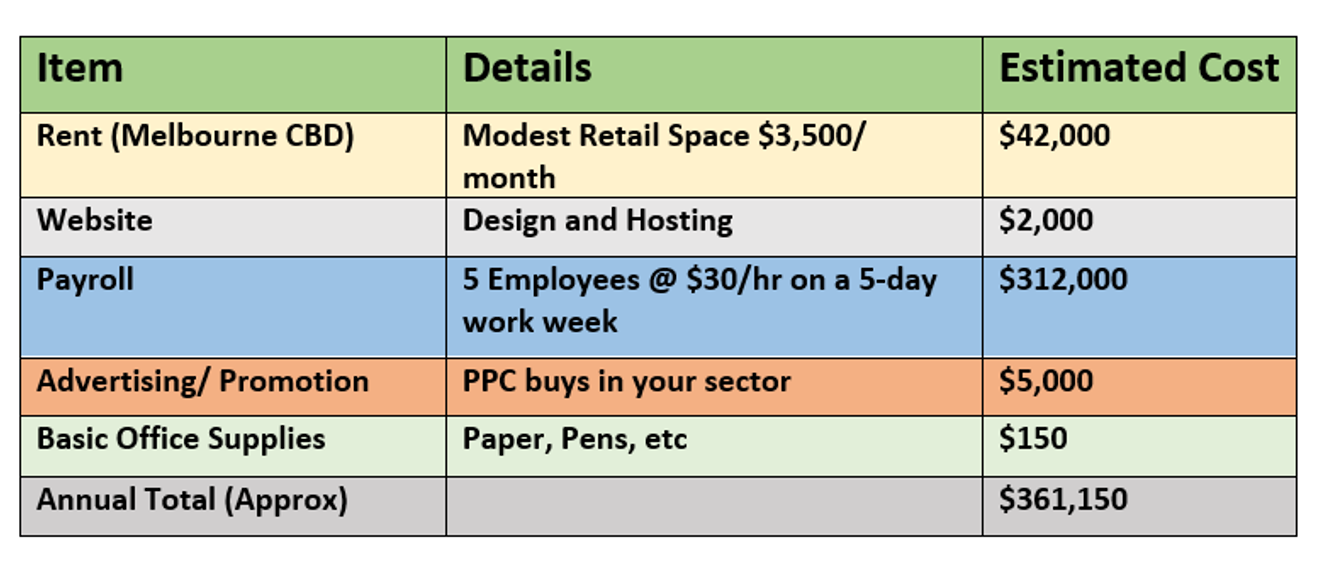
The unit cost of making products is forecasted as $4 because it is projected that the production cost is around 70% of the product price. It is expected to make at least 3000 sales per day in the following 5 years. The investment into sales and marketing is projected to be $5,000 (see table 4A) and gradually increases every year. The administrative expenses are forecasted at $150 in the first year (see table 4A) and grow in the following years. The calculation is based on these projections, which show a positive scenario for the company.
Table 1: P&L
Balance Sheet
Fixed assets in the following table consider office supplies but do not include the kitchen inventory yet. Also, in the positive scenario of the company making sales from the first year of entering the market, it is assumed that the company will not have debts to local investors. It is also expected that $361,150 that company headquarters invest into Australian office will be paid back in the first year.
Table 2: Balance Sheet
Major Assumptions
The major assumptions can be categorized into two main parts, which are cost-related assumptions and capital expenditure, funding, and tax-related expenditures. The projected cost-related expenditures for the first year can be observed in the following table.
Table 4A

The other expenditures can be seen in tables 1 and 2 – P&L and Balance Sheet. Some other expected spending will be represented in the table of cash flow in the following sections.
Cash-Flow Projections
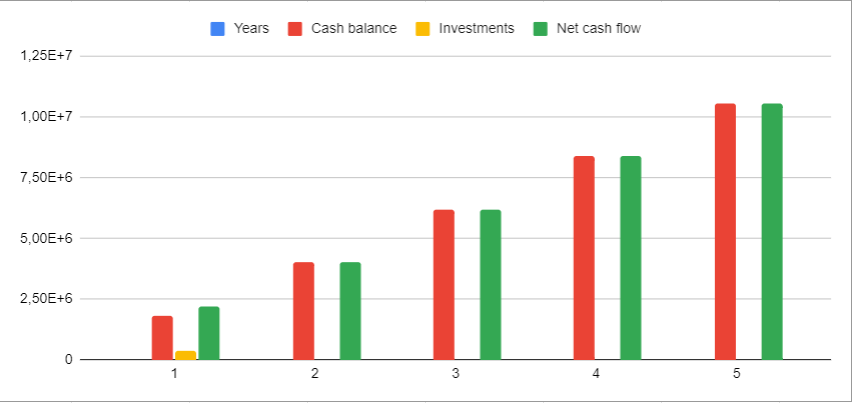
The money in the Australian office of Peta-Marron will mainly come from sales and investment from the company headquarters. It is expected that company headquarters will provide $361,000 until the office in Melbourne reaches a break-even point and is able to satisfy its costs by itself. The following chart presents data of forecasted sales (annual revenue is taken), investments, and their combination as net cashflow.
Table 4B: Cash flow

Break-Even Point Analysis
The break-even point analysis will help Peta-Marron understand how many sales are needed in order to at least pay-off the investment and costs, without getting a profit. The break-even point of Peta-Marron will be calculated with the following formula:
Break-even quantity = Fixed costs/ (Sales price per unit-Variable cost per unit)
The fixed cost for running Peta-Marron in Australia has been determined to be $361,150 (see Table 4A). The variable cost per unit is $4 and the sales price per unit is $6. So, the break-even point is 180,575 sales per year. It is projected that the company will make 3000 sales per day, meaning the break-even point will be reached within 6 months period.
Conclusion
To summarize, the Peta-Marron’s expansion to Australia from a financial point of view is a profitable activity. The revenue that company will make in the first year according to P&L analysis (see Table 1) equals approximately 6 million dollars, in which around 2 million dollars is an operational profit. As the break-even point analysis showed, the company will reach the break point within 6 months period and will pay off the initial investment within 1 year.
The balance sheet analysis showed that company will possess approximately 10 million dollars of profit which can be used for further investment into Australian office. The cash-flow projections have also stated that company’s cash-flow will increase every year steadily, which means that such growing office is worth investing.
Reference list
Apparent Consumption of Selected Foodstuffs – Australia. (2021) Web.
Difference between a business name and a trade mark. (2021) Web.
Butler, B. (2022) ‘Australia’s supply chain issues likely to continue despite drop in Covid cases.’, The Guardian: Business, Web.
Richardson, A., (June 2022), Biscuit Manufacturing in Australia Industry Report, IBISWorld