Introduction
Thermodynamics involves the investigation of energy and the various forms to which it changes (Simões and Piedade 3). When studying thermochemistry, it is crucial to consider any change in energy associated with a chemical reaction. Both physical and chemical changes must have an accompanying alteration in energy. This change is sometimes experienced as heat flow or accomplishment of work.
Enthalpy, H, is a state function that measures the heat content, q, of a body at constant pressure. Under the same pressure, the change in enthalpy is usually equivalent to the reaction heat. Change in enthalpy is usually denoted by ΔH. A chemical reaction that evolves heat is an exothermic reaction whereas a reaction that absorbs heat is said to be endothermic. In an exothermic reaction, ΔH is usually a negative value (less than 0) whereas, in endothermic reactions, the value is greater than 0 (a positive value).
Enthalpy changes can be determined through experiments by measuring the temperature changes in the course of a chemical reaction. The drift of energy from one body (with a higher temperature) to another body (with a lower temperature) is measured in terms of heat, q. It is possible to compute the mathematical value for the reaction heat by cautiously keeping an eye on changes that arise during a chemical reaction.
Quantifying the flow of heat is called calorimetry (Simões and Piedade 3). Specialized equipment that carries out this function is the calorimeter. In the determination of the reaction heat for a particular experiment, a reaction occurs inside a calorimeter. Heat changes are measured inside the calorimeter. Calorimetry follows the Law of Conservation of Energy which implies that the quantity of heat lost by one body is the same heat gained by a different body (Wilson 32). This experiment aimed at constructing a calorimeter, determining its specific heat capacity and thereafter using the same calorimeter to resolve the molar enthalpy of neutralization for HCl.
Experimental
Part 1: Calibration: Heat Capacity of the Calorimeter
A calorimeter was constructed by layering two polystyrene cups together. A thermometer was then carefully slipped into a rubber stopper with a hole. The polystyrene cups were then put in a 400ml beaker for the purposes of stability. The thermometer was positioned in the opening of the cardboard cover and its position was fiddled with to avoid the thermometer getting too deep into the calorimeter. This was because the thermometer was not supposed to get in touch with the base of the cup.
The weight of the calorimeter without its lid was taken and recorded using an analytical balance. 50 ml of deionized water was added to the calorimeter and the weight was taken and documented. The calorimeter’s cover was replaced, and the system was left to attain thermal equilibrium for about 10 minutes. Thereafter, the temperature was measured to the nearest 0.1oC and recorded. 50ml of deionized water was heated in a beaker to a temperature of approximately 60oC. The temperature of the tepid water was also recorded to the nearest 0.1 oC.
The warm water was poured into the calorimeter without delay, whirling the beaker gently so as to mix the warm and cold water properly and enable more precise measurements. The lid together with the thermometer was put back to the calorimeter and the contents cautiously mixed. A temperature reading was taken after every five seconds for the first 15 seconds. Thereafter, the temperature was observed for 3 minutes, documenting the changes at each 15-second interval. The calorimeter lid was removed, and the weight of the calorimeter (together with the mixture of warm and cold water) was taken using the same set of scales that had been used earlier in the experiment.
The heat capacity of the calorimeters was calculated from the obtained values. The calorimeters were then dried using paper towels. Similar steps were repeated to obtain temperature and time values for the calorimeter in a second trial, thereafter using the average of the two trial values in the second phase of the experiment.
Part 2: Heat of Neutralization of HCl
The two polystyrene cups previously used in part 1 of the experiment were dried and 55.0 ml of 1.0 M NaOH was added to them using a graduated cylinder. The exact concentration of the base was recorded. The lid was replaced, and the two substances (calorimeter and base) were allowed to equilibrate for about 5 minutes. 45.0ml of standardized 1.0M HCl was obtained and transferred to a clean beaker. Its precise concentration was then measured and recorded. A different thermometer was used to determine the temperature of HCl in the beaker to the nearest 0.1oC. The temperature of the acid was brought close to that of the NaOH (within ± 0.5oC) by either cooling on an ice bath or warming on the hot plate. The acid was then carefully transferred into the calorimeter containing NaOH. The contents were mixed holding the calorimeter by the brim.
A temperature reading was taken after every 5 seconds for the first 15 seconds. Thereafter, the temperature was observed for 3 minutes, documenting the changes at each 15-second interval. The lid and thermometer were removed to allow measurement of the weights of the calorimeter and combined solution. The acid-base mixture was discarded and a second trial experiment was performed.
Data and Calculation
Part 1: Heat Capacity of Calorimeter
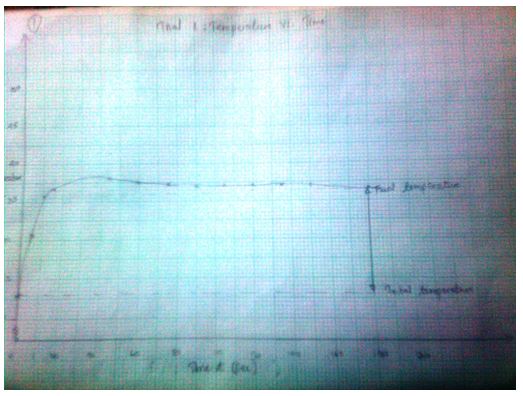
Trial 1: Temperature vs. Time (T, oC) as a function of time (t, sec)
37.1

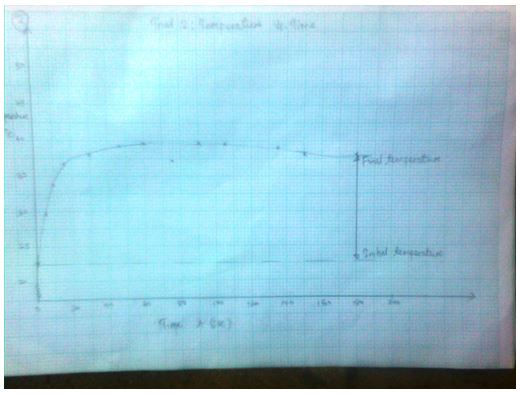
Trial 2: Temperature vs. Time (T, oC) as a function of time (t, sec)

Data Table 1
Part 2 A: Heat of Neutralization of HCl
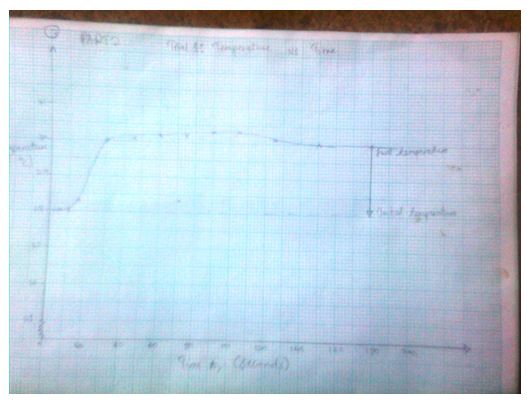
Trial1: Temperature vs. Time (T, oC) as a function of time (t, sec)

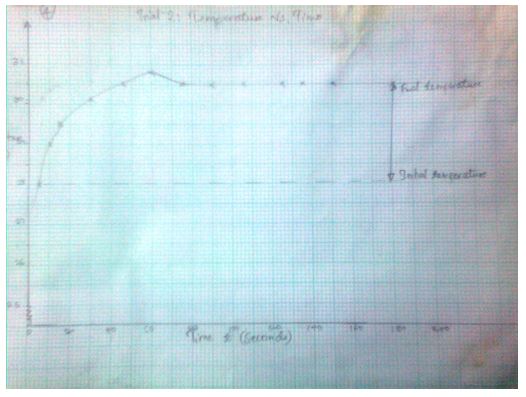
Trial 2: Temperature vs. Time (T, oC) as a function of time (t, sec)

Data Table 2
Calculations
- Heat capacity of the calorimeter using equation 6.
ΔTcal = (40.1+41.2) ÷2
= 40.65
C SH H2O= 4.184J/g.oC
mhot= (42.4814+43.0814)÷2
= 42.7814g
mcold= 50.6417gFrom equation 6,
–mhotC SH H2O ΔThot= mcold+ CcalΔTcal (1) where ΔTcal is the change in temperature of the calorimeter, mcold is the mass of cold water, Ccal is the specific heat capacity for the calorimeter, mhot is the mass of cold water, C SH H2O is the specific heat capacity for water, and ΔThot is the temperature of hot water.
Substituting the actual values in the equation gives
-(-42.7814×4.184)= 50.6417+ Ccal×40.65
178.993= 50.6417+ Ccal×40.65
178.993-50.6417= Ccal×40.65
128.3513= Ccal×40.65
128.3513÷40.65= Ccal
3.1574 J= Ccal - The final temperature readings as portrayed by the graphs are indicated in the data tables.
- Heat evolved during the neutralization (Specific heat capacity is equal to that of water =4.184J/g.oC). Mass of the reactants and products is equivalent to the average of the 1st and 2nd trial. This was equal to (93.5621+93.3876) ÷2 =93.47485g. The temperature change for the reaction was the average temperature form the two trials, which were, (2.5+2.1) ÷2=2.3oC. Therefore, ΔHrxn= m×ΔT×c (2) where ΔHrxn is the energy change for the reaction, m is the mass of the products, ΔT is the change in temperature and c is the specific heat capacity of water.
ΔHrxn = 93.47485g×2.3oC×4.184J/goC
ΔHrxn =899.527J. - The number of moles of acid contained in 45.0mL of the acid solution and the molar heat of neutralization using equation 11.
The concentration of the acid is 1.0146M. This meant that 1000mL of the acid contain 1.0146moles. Therefore, the number of moles in 45.0mL of the acid will be equal to (1.0146moles×45.0mL) ÷1000mL=0.044657 moles.
From equation 11, ΔH neutralization, molar= Δ H rxn/n. The calculated ΔHrxn is 899.527J and n is equal to 0.44657moles.
Therefore, ΔH neutralization, molar =899.527J÷0.44657moles.
Molar heat of neutralization is equal to 2014.3023J/mol.
Results and Discussion
In both parts of the experiment, the first and second trial values were used in computing the required parameters. That was because both experiments yielded values that possessed the desired attributes as per the laboratory guidelines. The final temperatures for each trial experiment were obtained from the plotted graphs.
There was a possibility that the values obtained from the experiment were not accurate because of errors during the experiment. Such errors arose from meniscus errors during the reading of temperature values from the thermometer. This led to either too high or too low values being recorded. There was possibly loss of heat to the environment during mixing of hot and cold liquids hence leading to discrepancies in the obtained values. That heat loss could have occurred by convection or conduction. Another possible source of errors was poor timing leading to either delays or too early documentation of data.
Conclusion
The experiments showed that the molar heat of neutralization for hydrochloric acid was 2014.3023J/mol and that the heat capacity for the calorimeter was 3.1574 J. This experiment was significant because it showed that it was feasible to establish the quantities of heat absorbed or lost during chemical reactions using calorimetry. It was also possible to combine known theoretical values with experimental values to compute important information on chemical compounds such as the molar heat of neutralization for HCl. Determination of the specific heat capacity of the calorimeter was essential for future experiments using the same calorimeter. The accuracy of this method can be improved in the future by using insulating material to minimize heat loss from the calorimeter by conduction and convection.
Application
Date of the experiment:
Heat capacity of the calorimeter: 15.29
Mass of NH4NO3 used in the lab: 2.42g, 2.97g
Mass of solution afterwards: 107.12g, 105.2g
Volume of water added: 100ml, 100mlInitial temperature of water 24.1ml, 24.1ml
Final temperature of solution: 21.9, 21.6
Molar heat of solution for NH4NO3=100×4.18J/goC×(24.1-21.75)
=+982.3J per 100gm.
For 1mol (1000g), the molar heat of solution is (982.3J×1000)÷100=9823 J/mol.
Cold Pack design
Planned temperature change for cold pack: cold packs absorb heat from the environment when they react resulting in a reduction in temperatures (endothermic reactions).
Planned amount of water in the cold pack: 100ml.
Planned amount of NH4NO3 in cold pack: 2g
A cold pack may be stored by keeping them refrigerated and only taking them out of their cold compartments when needed.
References
Simões, José A. Martinho & Piedade, Manuel Minas da. Molecular Energetics: Consensed-Phase Thermochemical Techniques. New York, NY: Oxford University Press, 2008. Print.
Wilson, R. J. “Calorimetry” Ed. Peter Haines. Principles of Thermal analysis and Calorimetry. Cambridge: Royal Society of Chemistry 2002. 129-135. Print.