Abstract
This study analyzes the torsion issue that arises with open-cross-section bars with corrugated boundaries. Using the perturbation technique, an analytical solution that is close is provided. The issue is first analytically resolved after formulating the stress analysis for a circular open cross-section with any opening angle. Second, the perturbation approach is used to study the open cross-section with a corrugated cross-section. Torque and stress first-order contributions have been introduced. The outcomes have been illustrated and contrasted by taking into account specific examples.
Introduction
Since applied torques cause the members to fail, the Torsion of bars with solid or open cross sections is an old but crucial topic in structural engineering. Therefore, substantial research has been done in the literature on the Torsion of prismatic bars with solid, closed, and open cross-sections (Devi et al., 2019). Different solid cross-sectional shapes have had exact and approximate solutions discovered utilizing the separation of variables, direct integration method, conformal mapping method, and semi-inverse method. The Torsion of cylindrical bars with corrugated surfaces has also been researched along the same lines. Because of their susceptibility to developing severe twist angles, thin-walled steel sections subjected to twisting moments have garnered much attention in recent years.
Apparatus
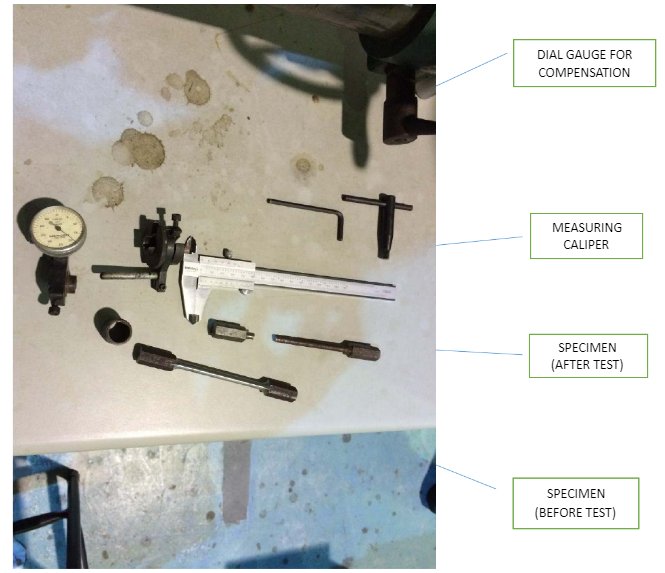
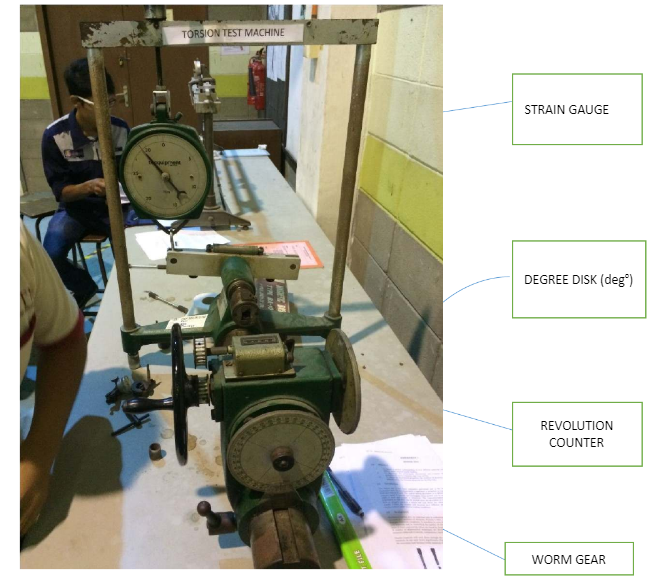
- The torsion testing rig is the device that will apply Torque to the shaft fixed between holding clamps, as shown in Figure 1 below
- Torque
- Measuring dial

Procedure
Remove the securing screws and slide the rod into the chucks on the test equipment. A rod’s tension can be adjusted by screwing in, adjusting nuts, and sliding a lever. Take a reading at a predetermined length, say 200 mm. Consider the rod’s diameter. Find out how far out from the rod’s center the point of application is. Check this value against the one listed on the Lab poster by clicking here. Calculate the Vernier measurement point’s radial distance from the rod’s geometric center. Check it against the cost of the tools you need; Zero out the Vanier scale or note the Zero Load spot. Gradually apply Loads while keeping track of the Deflection at the Vernier point. Be sure to note how many times the gauge reader has been turned and how many full turns that number represents. Observe the bending moments when the load increases in 100 gm (force) increments from 0 to 2000 gm. Do this for each of the specimens. Alter the parameters (length, maximum span, and steepness) by 150 mm, 100 mm, and 450 mm, respectively, and re-evaluate the results, as shown in Figure 2 below.

Results

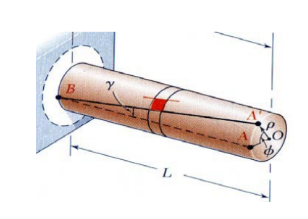
In a torque, as shown in Figure 3 above, against the angle of twist relationship, the modulus of rigidity or shear modulus of the tested specimen can be determined by using the following relationship:
G=TL/Jφ
and G= τ/γ
Where:
- T=applied torque
- L=length of shaft
- G=modulus of rigidity
- φ=angle of twist within the tested length
The largest shear stress occurs at the outside surface of the material and can be calculated using the following relationship:
τ =Tr/J
Where:
- τ =shear stress
- r=radius of shaft
- J=polar moment of inertia
The shearing strain occurs along the tested length of the shaft and can be determined using the following relationship:
γ =rφ/ L
Where:
- γ =shear strain
The relationship between the modulus of rigidity and modulus of elasticity within the linear elastic range of the material is described by Hooke’s law, which relates the Poisson’s ratio of the tested material is given by;
E=2G(1+v)
Where:
- v=Poisson’s ratio
- E=modulus of elasticity
The Torque can also be obtained using the following relationship;
T=G (J θ)
Where:
- θ =φ/L =angle of twist per unit length
Calculating the polar moment of inertia:
- J= (π ×D^4)/32
- J= (π ×6^4)/32
- J= 127.17 mm^4
Calculating Modulus of Rigidity:
- G= T/θ×l/J
- G= 45960×76.5/127.17
- G= 27641.54 N/ (mm2)
Calculating shear Stresses:
- τ/r = Gθ/l
- τ/r = T/J

Discussion
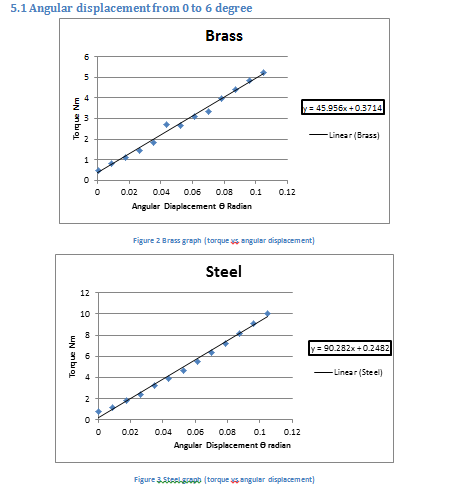
Brass and steel exhibit a straight line when plotted against Torque vs angular displacement, as shown in Figure 4 above. The calculation section up top includes some example calculations for the polar moment of inertia of the specimen (Liang et al., 2019). Experiment results may be impacted by human error in equipment calibration, load application, and reading interpretation. The machine’s limitations are another potential source of inaccurate results. The shaft’s diameter, not its length, determines the second polar moment of inertia J. In other words, the polar moment of inertia is utterly unrelated to the specimen’s length and will not change the result of the computation. During the experiment, the specimen is clamped firmly in the jaws, and preload is applied to keep the specimen straight. A loss of grip poses risks to the operator, the specimen, and the equipment. Because of the difficulty in interpreting a constantly changing scale, a torque reading should be obtained when the scale is steady. The exact moment of failure under torsion stress is unknown and cannot be calculated. Without internal flaws or fractures, the region of greatest stress concentration is where things tend to break.
Conclusion
Overall, this lab successfully achieved its aims; the students completed the torsion testing tests and the data reduction. Torque values were within a wide range of their theoretical values, with the largest inaccuracy coming from the brass specimen at 22.74 %. Experiment results are used to determine the rigidity modulus values, and shear stresses after the materials have been subjected to torsion tests. Steel can endure more shear stress strains than the other two materials because it has the highest stiffness modulus and applied Torque at failure.
References
Devi, S. V., Singh, T. G., & Singh, K. D. (2019). Cold-formed steel square hollow members with circular perforations subjected to Torsion. Journal of Constructional Steel Research, 162, 105730. Web.
Liang, Y., Jeyapragasam, V. V. K., Zhang, L., & Zhao, O. (2019). Flexural-torsional buckling behavior of fixed-ended hot-rolled austenitic stainless steel equal-leg angle section columns. Journal of Constructional Steel Research, 154, 43-54. Web.