Introduction
Macroeconomic indicators such as employment statistics, the real GDP, NDP, exchange rate, and current account statistics plays a very fundamental role in determining the economic prospect of a nation. In particular, the information relating to these economic variables are used by the government in planning and other key decisions. Besides, the business community and investors to deem such data in governing their investment behavior. The statistics pertaining to these data are filed by the U.S. Department of Labour.
GDP Statistics 2005-2012
According to the Economic Bureau Analysis report released on April 27, 2012, the U.S. Department of Commerce presented a quarterly economic report based on the productivity and the general economic performance of the economy. The GDP for the first quarter in the year 2012 increased by 2.2% while the results for the last quarter of the calendar year 2011 posted a 3.0% increase in the GDP. The decline in economic growth reported in the first quarter of the year 2012 is a reflection of a lower growth rate in fixed investments and inventory by businesses. The fall in inventory investment performances was attributed to low businesses in the wholesale and manufacturing industries. However, inventory performance in retail sectors (especially the motor vehicle industry) recorded a boom in economic performances within the same period.
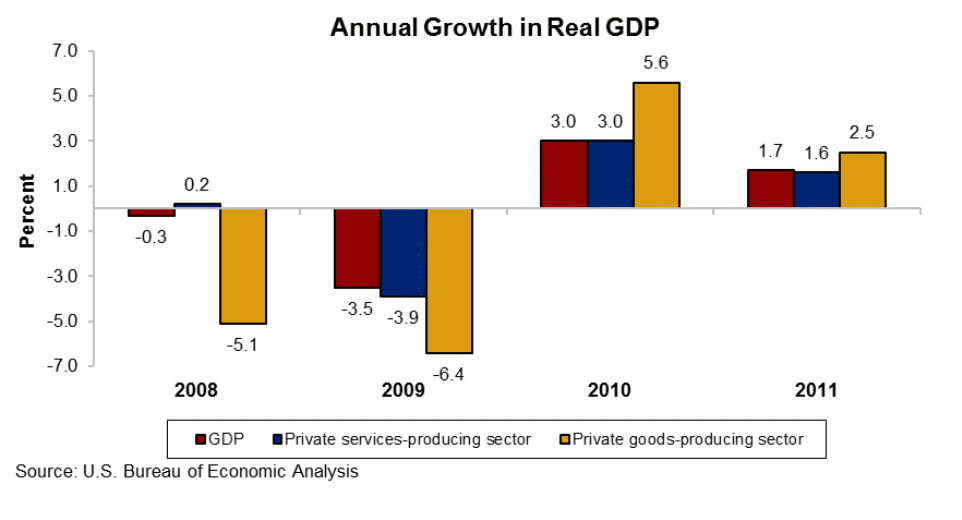
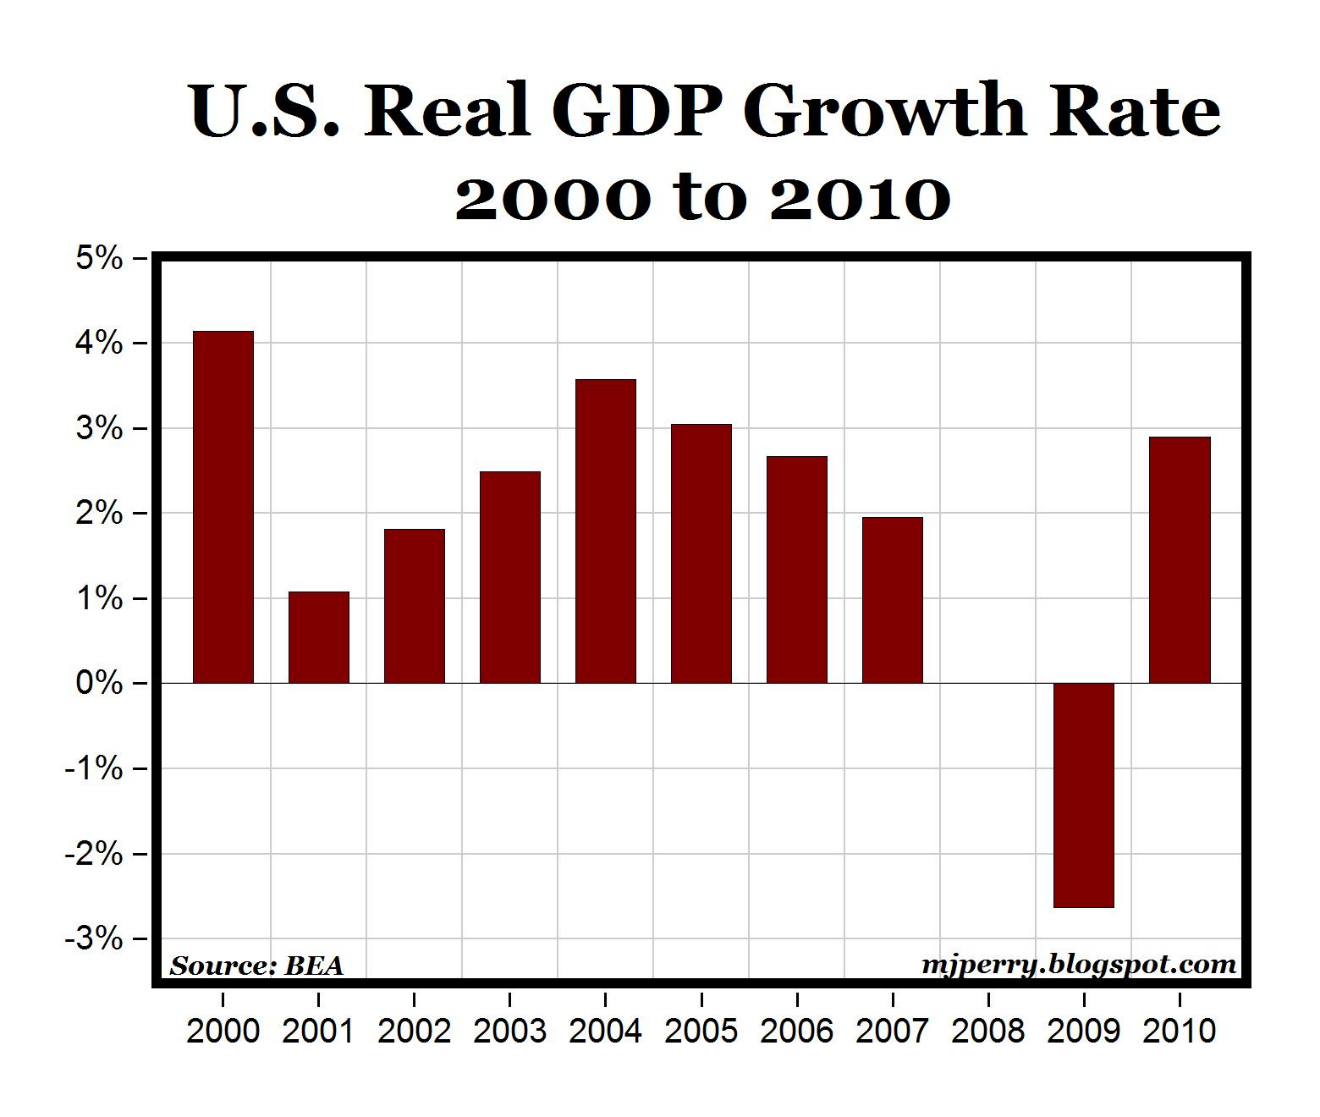
The U.S. GDP or 2011 is the highest ever since 2005. In 2011, the U.S. economy posted an annual GDP of 2.9% following the strengthening of the economy over the last quarter of the calendar year. Besides, this growth was boosted by increased overseas sales and returns reported by companies. In the last quarter alone (October-December), the economy grew by 3.2%. This was an improvement in the economic performance of the United States of America since 2009 when the U.S. economy suffered the worst performance in 60 years. The increased consumer spending on appliances, cars, furnishings, and clothes was the fundamental reason for the strong economic performance in 2011. In particular, household expenditure hit its highest since 2006, at 4.4% pace. Since consumer expenditures account for more 70% of the overall economic performance, economists are more optimistic that the GDP for the current period would be better than last year’s. In monetary value, the 2010 GDP posted a record high of $13.248 trillion, surpassing the 2007-2008 record of $13.228 trillion. In 2011 alone, the nominal GDP for the United States is reported to be over $15 trillion, which accounts for more than a quarter of the global economic GDP.
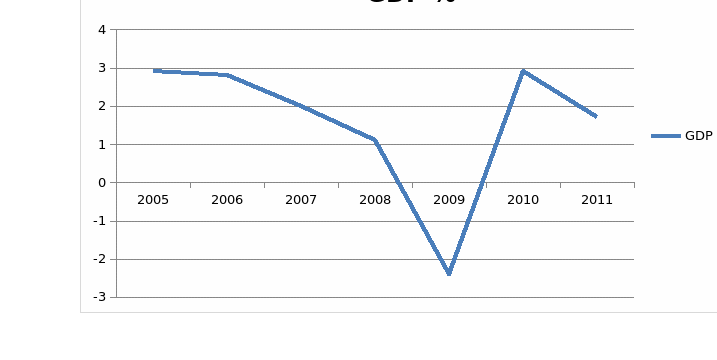
The 2011 economic performance of 2.9% can also be attributed to an increased volume of U.S. exports over the last quarter. Exports grew at approximately 10%, up from 5.8% in the third quarter of the same year. Economic experts project a further increase in export volume this year. However, the Federal Government spending only dipped a 0.6% of the national economic growth. This followed a cut by the federal government on expenditures on defense and local government allocations.
Unemployment Rates in the U.S. (2005-2011)
The unemployment rate is defined as the potentials labor forces actively looking for potential job opportunities at the prevailing wage rates expressed as a percentage of the labor force. Labour force is defined as the total number of the labor force plus the unemployed persons.
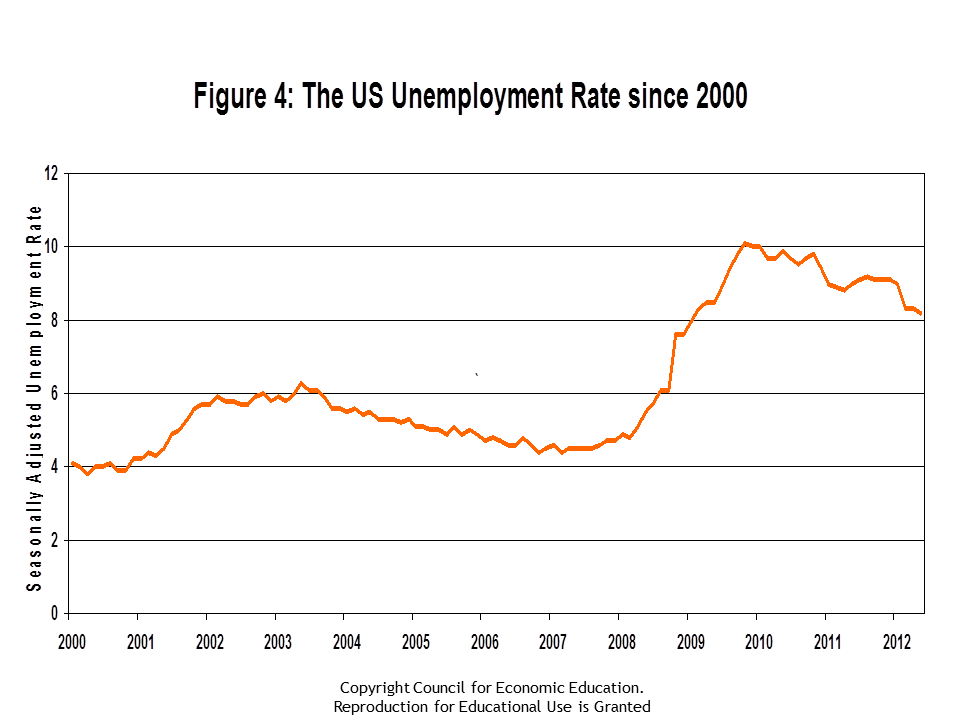
Source: Bureau of Labor Statistics, seasonally adjusted.
Unemployment levels in the U.S. are cyclical and largely related to the business cycle. However, other factors (including labor market policies, demographic developments) also have great influence, both in the long-term and in the short-run.
The above report indicates that, on average, the unemployment rate for the united states from 1948-2010 is at 5.7%. 1982 reported the highest unemployment rate ever in the history of the U.S. (10.80%) while the 1953 rate of 2.50% is the lowest ever recorded.
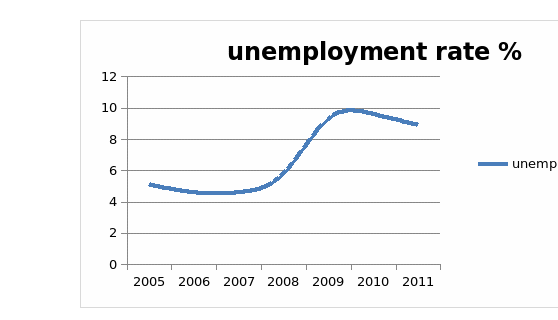
In 2005, the United States of America labour department reported an unemployment rate of 5.1 percent with the number of unemployed persons above sixteen years standing at 7.591 million. Over the next two years, the rate of unemployment fell to 4.6%, with the unemployed estimated to be 7.01 million. From 2008 to 2010, the survey reported an increase in the rate of unemployment. In 2008, the figure stood at 5.8%, 2009-9.3% and 2010-9.6%. These increases in the rate of unemployment were associated with economic recession over the same period. Between 2008 and 2009, the global economic crisis hit the United States, which forced the government to apply deflationary fiscal policy. The government therefore had to cut its expenditure which further reduced the employment creation as the economy was suppressed.
After economic recovery, the government changed its policies regarding expenditure and budgetary allocation. In last quarter of the fiscal year 2010, the U.S. government through proposed an expansionary fiscal and monetary policy which was a significant boost in job creation. As a result, the unemployment rate slightly declined from 9.6% in 2010 to 8.9% in 2011 and to 8.6% in the first quarter of the year 2012 (www.bls.gov/bls/ceswomen_usps.htm). The number of the unemployed however is increasing overtime following changes in the demographic statistics of the U.S. In 2011 alone, approximately 13.2 million Americans were unemployed.
In terms of sex, men constitute 48.82% of the unemployed persons while women accounted for the remaining 51.18% of the unemployed. The unemployment rate among adults (those above 45 years) was about 7.45% with men at 7.5% and women at 7.4%. Teens had the highest rate of unemployment at 24.9% in 2011. Racially, the unemployment rate among the whites stood at 7.4%, Hispanics- 10.3%, blacks-13% and asians-5%.
Works Cited
U.S. Department of Commerce. Bureau of Economic Analysis, Monthly Economic Review. 2012. Web.
U.S. Department of Labor. Bureau of Labor Statistics; Corrections to Current Employment Statistics Data. 2012. Web.