Confidence intervals are statistical tools that help measure the uncertainty of a sampled variable. Due to technical limitations and a lack of resources, researchers cannot use the general population, so they have to restrict themselves to small representative samples. Extrapolating the measured value from the sample to the population is risky, so confidence intervals can reduce this uncertainty (El-Masri, 2012). In the clinical sciences, the use of confidence intervals proves crucial because it minimizes threats to public health by specifying quantities. For example, when developing drugs in market quantities, it is critical to use the exact value of the active agent, and using a 99% confidence interval creates a requirement of near-analytical accuracy for calculating the mass of that substance. Another example is comparing the results of multiple patient-responder groups to develop preventive measures for reliable results (El-Masri, 2012). In fact, there are more opportunities to use confidence intervals of varying accuracy in health care. For population mortality counts, including COVID-19, it is critical to be consistent and provide the most reliable statistical measurements. A confidence interval allows us to cover the weakness in the form of uncertainties due to natural variation and dynamics. Thus, confidence intervals in the medical sciences are used to improve accuracy and minimize errors, the price of which can be equal to human lives and health.
A convenience sampling method was used to collect the ten growth data, which consisted of interviewing the respondents most conveniently available to the experiment initiator. Not every person in the population had an equally likely chance of being selected for the study, and thus the likelihood of systematic errors and bias increased. Instead, I could divide the class into separate clusters so that they differed significantly from each other (McCombes, 2019). I would select 1-2 respondents from each cluster to increase diversity and representativeness: this is a stratified sampling method. However, it is not known for certain where and how the data was collected by the professor.
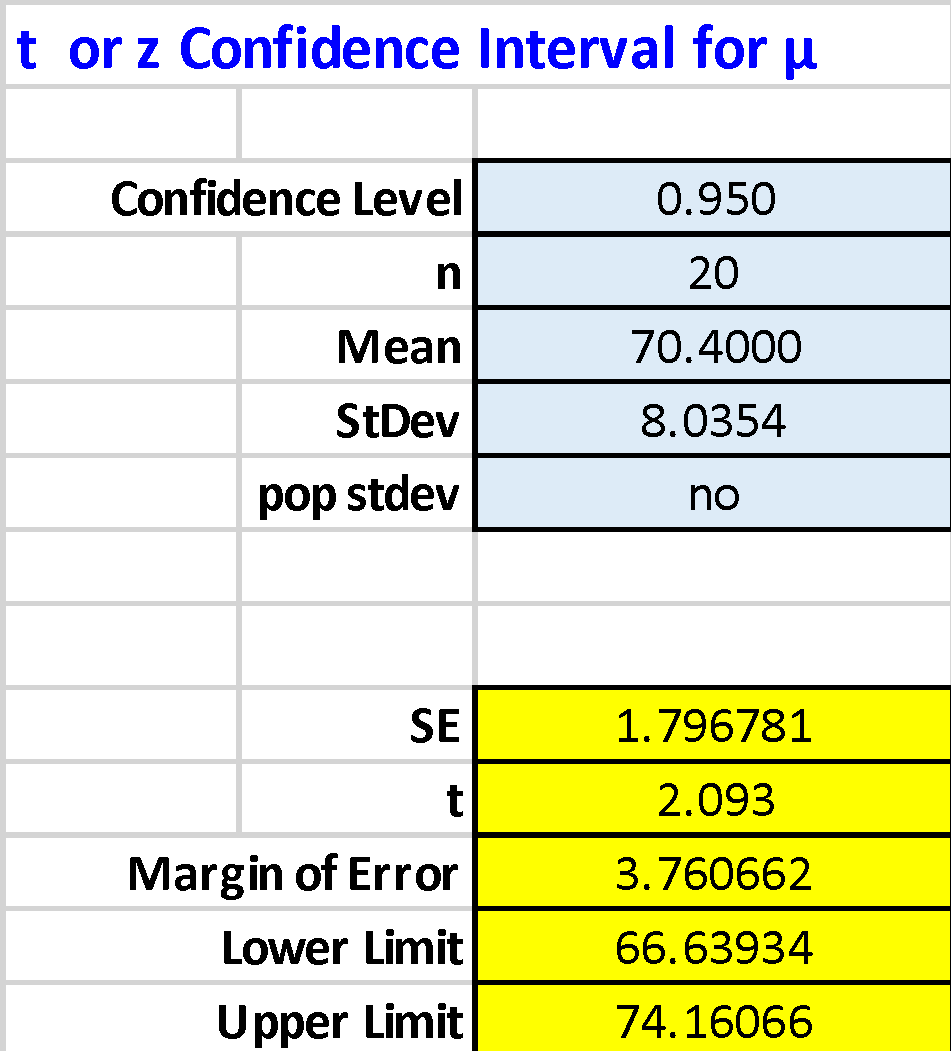
- For a sample of twenty respondents, the mean was 70.4.
- Using MS Excel, a 95% confidence interval was calculated for the previously calculated mean. This was as follows: 95% [66.6, 74.2].
- The 95% confidence interval was that the true mean height for the general population was between 66.6 and 74.2 inches.


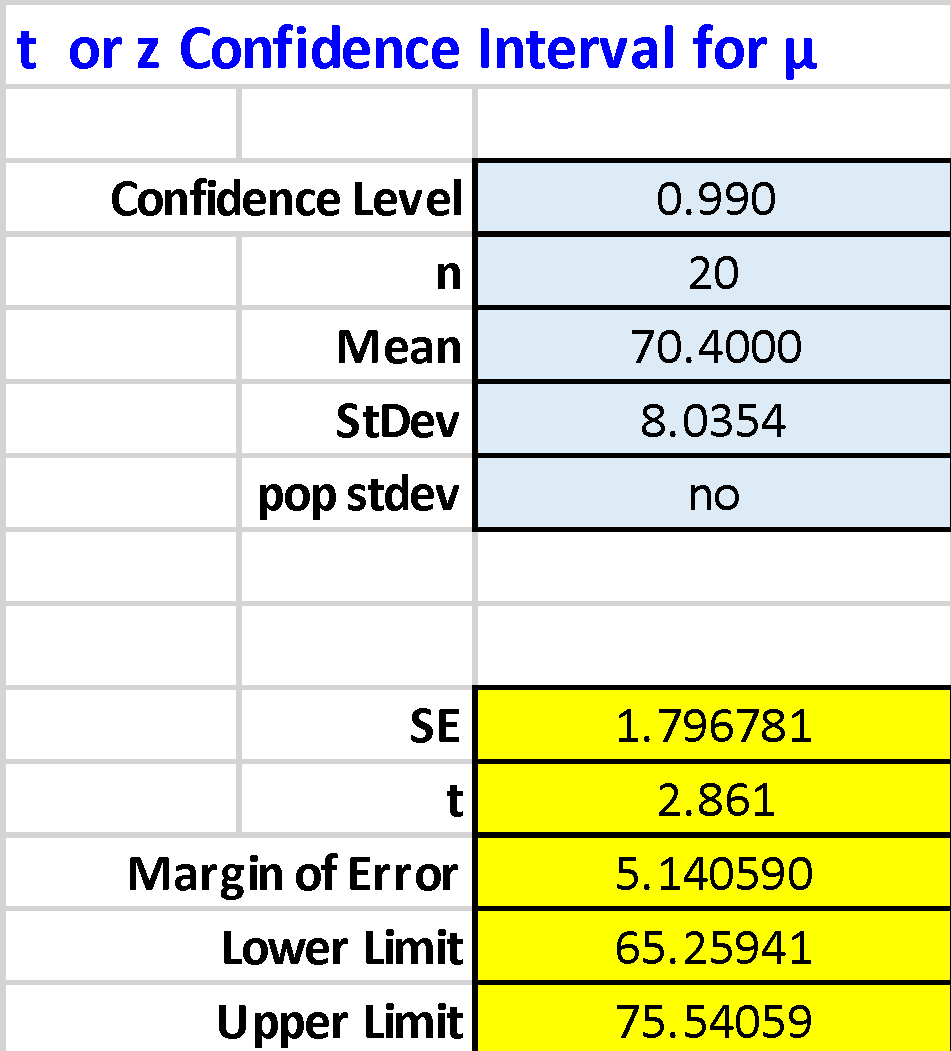
It is well seen that as the accuracy of the confidence interval is increased (up to 99%), the margins are more comprehensive because the probability of being confident in the location of the actual population value is increased. In other words, for a 95% confidence interval, there is a 5% probability of being wrong, but for a 99% interval, this probability is reduced to 1%. Consequently, the final interval must be wider to cover more values. The ME value indicates how much the calculated value will differ from the real value. When the confidence interval is increased to 99% (widening the range), the ME is naturally higher because the spread relative to the true mean is increased. To put it another way, the error will always grow instead of increasing the accuracy of the confidence interval, which is the necessary price to pay for getting more certainty: the higher the desired accuracy of locating the actual value, the higher the probability of being wrong.
References
El-Masri, M. (2012). Confidence intervals: Part 1 [PDF document]. Web.
El-Masri, M. (2012). Confidence intervals: Part 2 [PDF document]. Web.
McCombes, S. (2019). Sampling methods | types and techniques explained. Scribbr. Web.