Introduction
The Regional Real Estate Company wants to determine the average cost of real estate in the pacific region. The salespeople estimate that the average cost of real estate in the region is $275 per square foot. However, this information is to be presented in an advertisement. Consequently, the data must be evaluated to determine if the average price is as stated by the marketers to avoid misleading the customers. The salespeople collected price data on 1001 real estate properties in the region to test whether the average price differs from the stated average.
Set Up
The objective of this test is to determine if the average sales price for the real estate prices differs from the estimated value of $275. The test used price data from the 1,001 properties sold by the Regional Real Estate Company in the United States. Therefore, the sampling frame was the real estate sales prices in the country, while the sample was the 1,001 units sold by the company. The population parameter of interest was the average price per square meter. The following are the null and alternative hypothesis.
Null Hypothesis, H0: The mean house prices is higher than $275 per square meter, i.e., µ0≥$275
Alternative Hypothesis, H1: The mean house prices is equal to $275 per square meter, i.e., µ0<$275
This is a right-tailed test because the analysis wants to determine if the average price is higher than $275. The test will be carried out at 5% level of significance.
Data Analysis and Preparation
The house price data was downloaded from the Realtor.com (2021) website. Table 1 shows the descriptive statistics for the three numerical variables.
Table 1. Descriptive statistics.
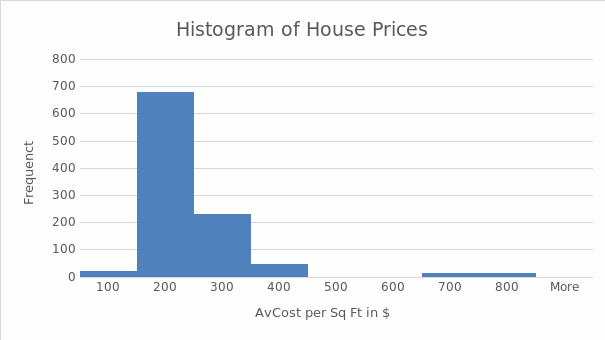
The average cost per square foot was $196.57, which was lower than the hypothesized average price of $275 per square foot. Figure 1 shows the distribution of the average cost per square mile.

From figure 1, it is clear that the average price of real estate prices has a positive skew. Therefore, most of the house prices are located to the left of the mean price. Nevertheless, the skewness does not violate the conditions of a normal distribution, which requires a symmetrical and bell-shaped curve. Most of the real estate properties had an average price ranging from $200-$400 per square foot. However, a few houses had extremely high price that exceeded $700, which caused an extended right tail for the histogram. Similarly, some few houses had a very low average price per square foot, which was well below the hypothesized average. Nonetheless, the distribution approximated a bell-shaped curve, and a normal probability test could be conducted to determine if the actual average price differed from the hypothesized difference.
Testing the Hypothesis
The sample size is greater than 30, which is sufficient to conduct a normal probability test. The test was performed in the following steps.
- Calculating the test score
The test score is calculated as = (196.57 – 275) / 3.17 = -24.71
- P value from the z score (from the normal tables or from =tdist(257,999,1))= 0.0000
Conclusion. The p value is less than 5%, which provides sufficient justification to reject the null hypothesis. Consequently, we reject the null hypothesis, as the mean house prices is lower than $275 per square meter, i.e., µ0<$275
Test Decision
The test was conducted at 5% level of significance. Therefore, any calculated p value that is less than 5% gives sufficient evidence against the null hypothesis. In this case, the calculated p value was 0.000, which is less than the threshold p value of 5% (or the stated level of significance). As such, the difference in average and hypothesized prices was not due to random chance. Therefore, the average house prices are higher than $275 per square meter, and the advertisement should not be posted, as it will present a wrong assumption on the average cost of housing. Instead, the advertisement should read that the average house price is less than $200.
Conclusion
In conclusion, a one-tailed test for the average house prices showed that the hypothesized price of the house was higher than the actual average. The test, which was conducted at 5% level of significance, showed that the average house prices were lower than the hypothesized value of $275 per square meter. Therefore, the advertisement should not be posted, as it would portray a wrong assumption of the average price of these properties. While the average price differed significantly based on location and other factors, the mean price was below $200, which was supported by strong evidence from the above test. Hence, the advertisement should read that the average house price is less than $200.
Reference
Realtor.com. (2021).Real estate data. Web.