Data Example of 10 People With Different Heights

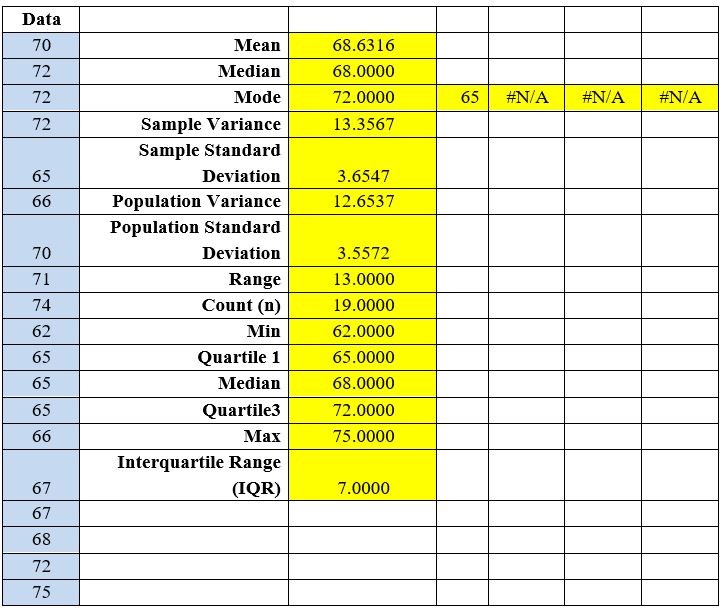
The mean and standard deviation of the data is:
Mean= 68.6316
SDV= 3.6547
The most often used metric of central tendency is the mean. The height of all the students I measure ranges within the mean (Tapli Et al., 2017). The mean is the average of the number of people’s height divided by the number. With the height of 67, my height is slightly below the average.
Background Information on the Group of People
Sampling method
The process utilized to pick participants is referred to as random selection. (Etikan, 2017). For instance, one might use randomization to acquire 10 individuals by picking names randomly from the group obtained.
Location of the Study
Up country-Texas
This place has childhood peers and their friends who were willing to take part in the assessment.
Age Ranges of the Participants
The age range of these participants was between 20-30 years.
Each Gender
This study had an equal number of boys and girls. The girls were shorter than the boy basing on the data that was obtained. It helped in having a gender-sensitive research which was done with the right approach to find the result. Lastly, this has helped in improving the accuracy of the analysis as it is based on actual data obtained (Grogan, 2018).
Interesting Factors
Short boys were laughed at by their peers who felt they might not find life partners for not being tall. The boys were generally stubborn to get their height as they felt they might look small before the girl. This group is united despite the diversity within its members as many are from different ethnicity but we still correlate. Furthermore, conflict of ideas will always develop as people have different kind of thinking. It is hard to break up this bond between these groups as many as supportive of each other.
The 68%, 95%, and 99.7% Values of the Empirical Rule in Terms of the 20 Heights in the Height Study

What Do These Values Tell You?
It indicates 95% of my observations will fall under 2 standard deviations from the average μ. And 90% of observations are said to be 7 percent (Schanzenbach & Sitkoff, 2017).

Finding Mean and Standard Division of the Group
In this lab assessment, data from a certain group of people in town x was used. This information was collected through measurement of height to find accurate heights of the participants. In the group there were six girls and four boys. Lastly, the teacher’s data of 62, 65, 65, 65, 66, 67, 67, 68, 72, and 75 will be used to complete the assignment
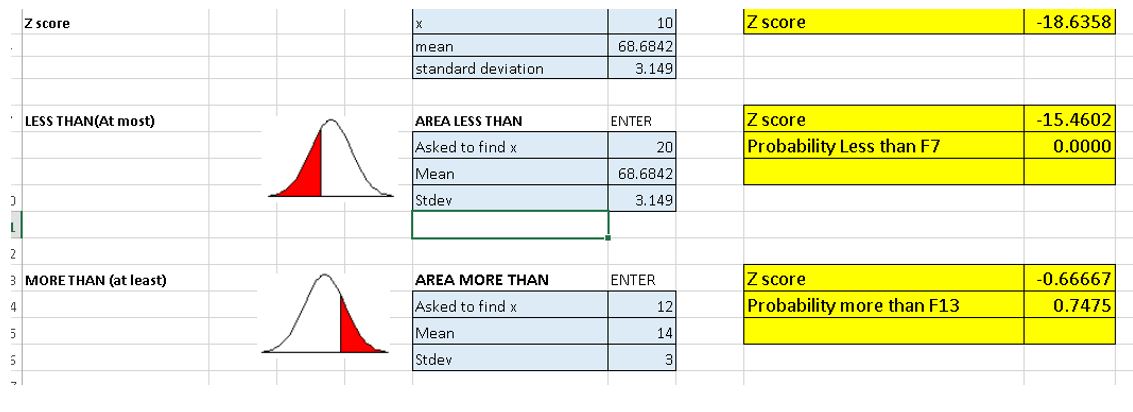
The mean and standard deviation of this data is 68.6842 and 3.5127 respectively. The height has a slight deviation from the mean height obtained in this analysis (Sarkar & Rashid, 2016). With the height of 75, this makes me taller than the rest. A proper measuring mechanism was used to reduce the number of error propagation. Further, proper mechanism were used to avoid parallax error like proper position of the eye while taking the readings (Close, 2017).
Analysis of the group
Sampling method
The population size at our work place is about 59 staff members; with 30 women and 29 men. Random sampling was chosen to choose people from the population as way of getting a detailed analysis. Random sampling can be accurate if done well, as it will represent an accurate account of the population characterises (Martino, 2019).
Location
This study was done in a town set up, at Walmat warehouse in Ohio. This group was chosen as it has a uniform distribution of data (Cristea & Paštéka, 2017).
Age Ranges
The pollution assessed had an age range of between 24 and 42 years.
Each Gender
This sample size was not evenly balance, there were more ladies willing to participate in the height taking. As mentions at the start, 6 ladies and 4 men were used to get the data needed to complete this task.
Interesting Factors
Work places are generally interesting as every person has diverse view of life. This assessment used the right group to get the data that made the analysis a success. With the age difference various factors were considered while choosing the right data to complete the assessment. Men are generally shy of their height in the presence of the ladies which is d key factor in choosing the population size.
Empirical Rule: Expressing the 68%, 95%, and 99.7% Values in the Context of the 20 Heights Analyzed in the Height Study

What Insights Can Be Gained from These Values?
It shows that 95% of the data are below two standard deviations from the mean μ meaning 90% is believed to represent 7% of the observations recorded.

References
Close, R. (2017). Parallax Error: The Aesthetics of Image Censorshipe.Cabinet, (Vol. 2, no. 2), 74-81. Web.
Cristea, L., & Paštéka, M. (2017). Uniform Distribution with Respect to Density.Uniform Distribution Theory, 12(1), 123-138. Web.
MARTINO, L. (2019). Independent Random Sampling Methods. Springer.
Sarkar, J., & Rashid, M. (2016). Visualizing Mean, Median, Mean Deviation, and Standard Deviation of a Set of Numbers. The American Statistician, 70(3), 304-312. Web.