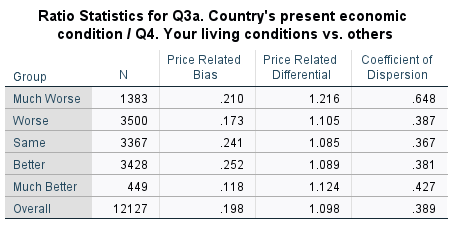
I chose to use the Afro barometer dataset for this assignment. The variables that capture my attention were the country’s present economic conditions (Q3a) and the living conditions of its citizens (Q4). I used ratio statistics to compare the two variables. The results of the analysis are recorded in Table 1. below.

In addition, I computed the mean and standard deviation for (Q1), which represents the age of the population in African countries. According to Mishra et al. (2019), the two computations are known as descriptive statistics. From the analysis, it is clear that the interviewer engaged citizens from the age of 18 (minimum) to 105 (maximum). However, the average age of the respondent is calculated in the mean, which is 37 years. The results of the analysis are recorded in Table 2. Below (Afro barometer, 2020)
Table 2. Descriptive statistics for Q1.
A country’s present economic condition (Q3a) measures the economic state of a nation using factors such as GDP, Inflation rate, the orientation of fiscal policies, and unemployment rate. On the other hand, people’s living conditions can be defined by income per day. Living conditions can be classified into low, middle, and high classes. For the analysis of the two sets of data, I used ratio statistics as the unit of analysis. Ratio statistics are used in quantitative data where the data used has the same definitive difference between them. Verbeeck et al. (2020) argue that in a ratio, absolute zero is assumed to be the point of origin. Broadly, the results of ratio statistics cannot be a negative value. The respondents’ living conditions as compared to others were recorded in an interval scale where numeric values were computed. However, a country’s present economic state was recorded using an ordinal scale. The interviewees were required to express their views using an ordinal scale comprised of; much worse, worse, same, better, and much better.
A comparison between the country’s present economic condition and the people’s living conditions is useful to the government, citizens, international investors, and well-wishers. The analysis results could be used to answer the social question; what is the living condition for citizens of countries with different economic states in Africa? The information is useful to the country’s government as it explains its current economic state as compared to others. It could also use the information in the planning and implementation of economic policies (Tchamyou, 2020). In addition, the citizen could use the information to establish the necessary measures they need to take to improve their condition. The information is also needed by investors before making investment decisions. Investors aim at financing projects in economically stable countries where they can easily make a profit. Well-wishers or non-profit making organizations could use the analysis results to determine which countries require their services most.
By analyzing the economic state and people living conditions in African countries, social change could be attained by attracting attention from various stakeholders in these countries. The desired change could help improve the situation that respondents live in by offering them; financial, infrastructural, education, health system, and nutritional support (Tchamyou, 2020). In conclusion, the analysis results show that a country’s economic state is directly proportional to the people’s living conditions. In other words, an improvement in a country’s economic condition would translate to an improvement in the living conditions of its citizens.
References
Afro barometer (2020). Dataset A. Web.
Mishra, P., Pandey, C. M., Singh, U., Gupta, A., Sahu, C., & Keshri, A. (2019). Descriptive statistics and normality tests for statistical data. Annals of cardiac anaesthesia, 22(1), 67.
Tchamyou, V. S. (2020). Education, lifelong learning, inequality and financial access: Evidence from African countries. Contemporary Social Science, 15(1), 7-25.
Verbeeck, J., Ozenne, B., & Anderson, W. N. (2020). Evaluation of inferential methods for the net benefit and win ratio statistics. Journal of biopharmaceutical statistics, 30(5), 765-782.