Introduction
To a layman, determining the flow rates of fluids is almost impossible. However, to a physicist this study, which employs simple equipment, is less intricate. Ideally, these devices explore the Bernoulli’s principle as regards pressure differences to determine the volumetric flow rates of fluids. These devices include the venturi meter, orifice plate, nozzle and a pitot tube among others. In this report, though, we employ these devices to determine volumetric flow rates as well as the coefficient of discharge (Cd) of both the venturi tube and the orifice. Moreover, the velocity disparities across square ducting were determined together with the extent of yaw which could be tolerated in pressure readings (for a 1% error).
Summary
Both the venturi tube and the orifice plate explore the Bernoulli’s principle to determine volumetric flow rates of incompressible liquids. As such, a factor such as the appropriate positioning of the pitot tube is important. When such reading is taken, care ought to be taken to ensure that the maximum reading is recorded (usually at the central axis). This is the reason that a 5 by 5 velocity pressure reading was done across the planes of the tubes. As we move away from the central axis friction on the inner walls of the tubes decreases the velocity.
Ideal results should give almost similar results for both venturi tube and orifice plate with respect to volumetric flow rates. However, we expect the venturi tube results (with a higher turndown usually 10:1) to be more accurate than orifice’s (turndown usually< 5:1). As such, with the venturi tube readings, we expect a bigger coefficient of discharge (Cd) (approaching 1) (Chrisafis, 2007).
The orifice plate and venturi tube explore the basic principle of continuity which underscores the fact that the volumetric flow rate (Q) of a fluid is constant, remaining unaffected by the change in the cross-sectional area (A) or the velocity (v). This is expressed as:
Making v2 the subject matter:
It should be noted that these devices obey the law of conservation of energy that is summarized as:
![]()
(The element z occurs when the device is at an angle with the horizontal surface).
For our case z is absent since the tubes are parallel and horizontal to the surface. It therefore follows that:
Replacing v2 in equation (2) with equation (1) and making v1 the subject formula we get:
![]() ……………………………………………………… (3)
……………………………………………………… (3)
But;
![]() ……………………………………………………… (4)
……………………………………………………… (4)
Therefore, replacing v1 in equation (4) we get:

And,
Where Cd represents the coefficient of discharge
Results and calculation
The air density

Table 1: showing the data above was treated (more results on the appendix)
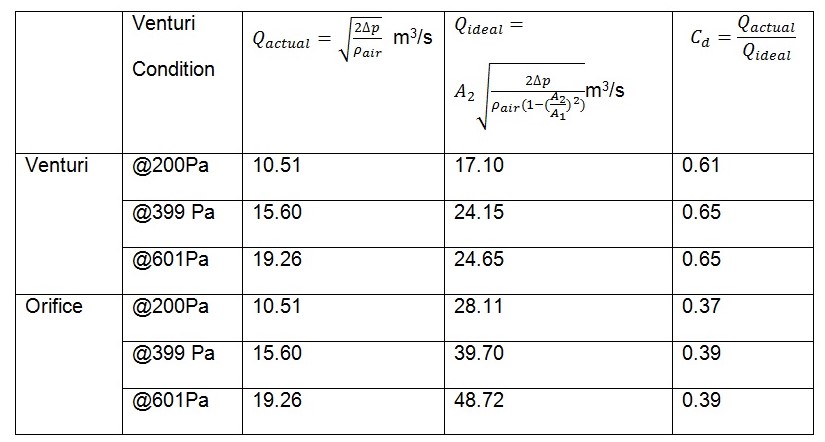
As regards, Cd it is impossible to obtain the ideal value owing to many factors that include friction on the inner walls of the tubes and variation in temperature conditions.
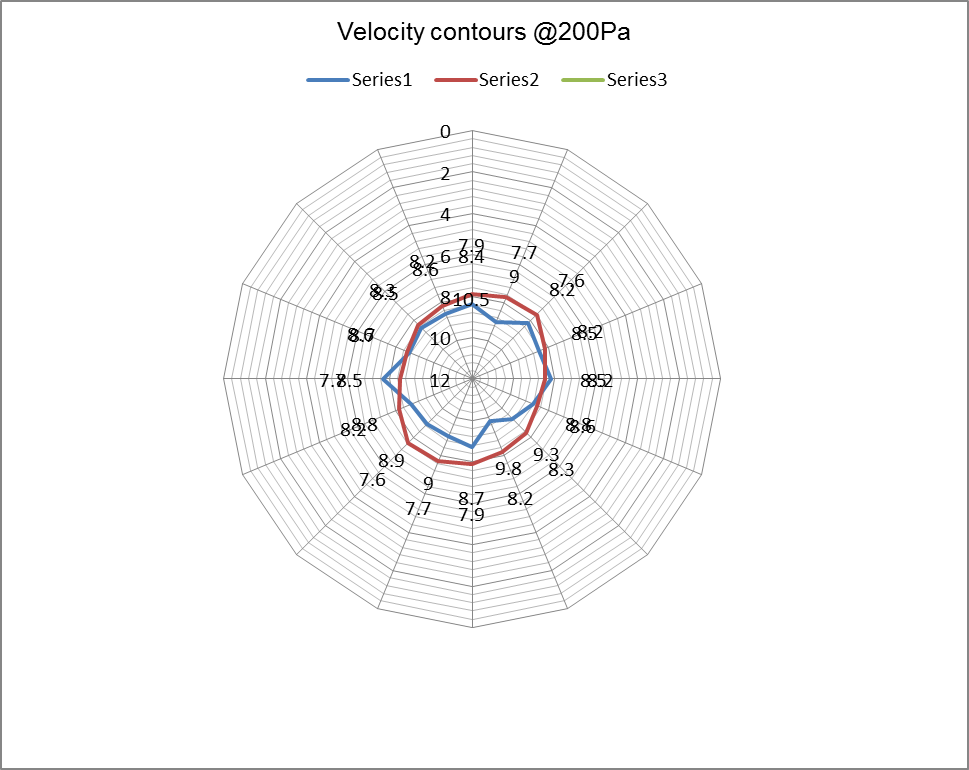
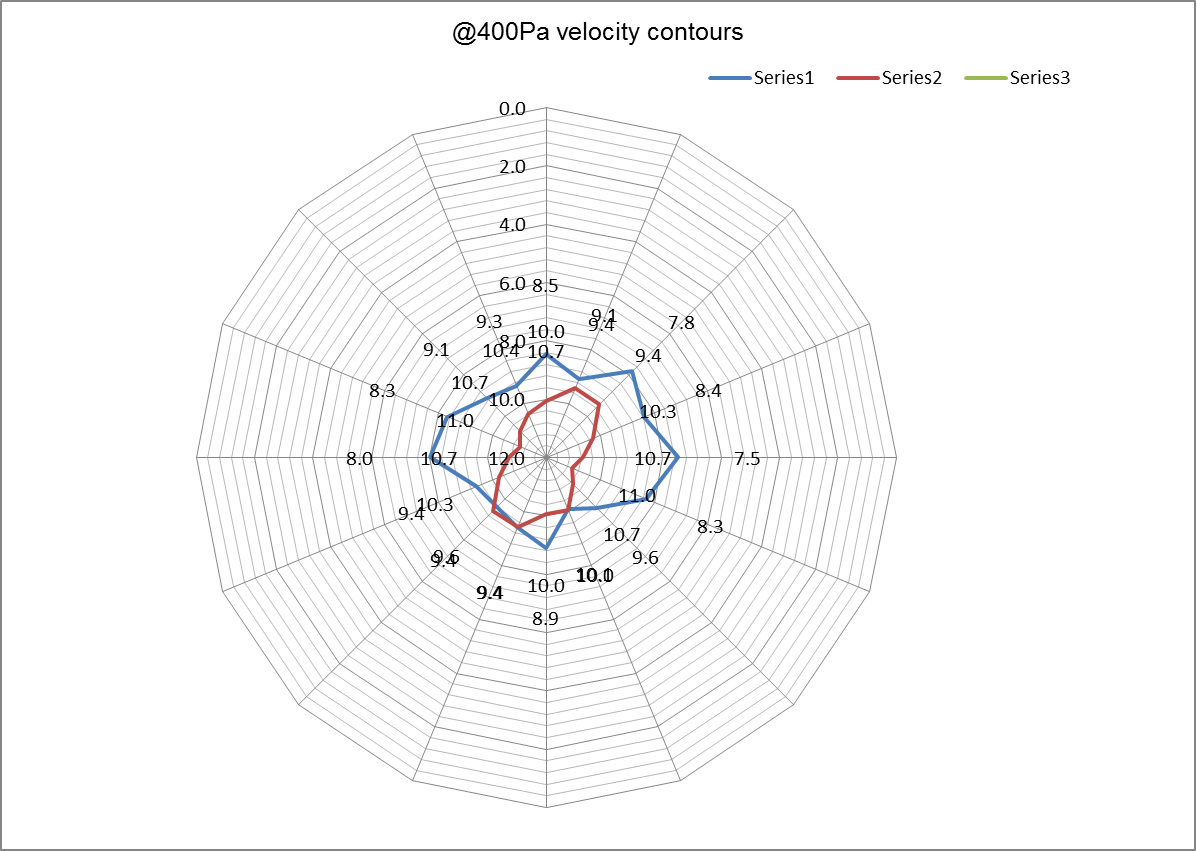
Velocity profiles.
Table 2: showing actual velocity profiles along the horizontal and vertical (@399Pa) axes
Discussion
In this lab, several data were collected with an aim of obtaining the objectives of the experiment. The main objectives of this experiment were: to determine volumetric flow rates, as well as the coefficient of discharge (Cd) for both the venturi tube and the orifice. Moreover, the velocity disparities across square ducting were determined together with the extent of yaw that could be tolerated in pressure readings (for a 1% error). All these objectives were obtained, giving credible results with minimal uncertainties.
With regards to the first experiment, the volumetric flow rates were determined using two methods- Pitot tube and arithmetically. The main idea here was to obtain both the actual and the ideal readings vital in determining Cd. The Cd obtained was as expected (<1) (see Table 1), with the venturi readings relatively bigger than that of the orifice. The Cd is < 1 owing to the effects of friction present on the inner walls of the duct that reduces fluid motion (see graph 1- velocity decreases radially towards the wall). The Cd value does also indicate that the venturi is more accurate than the orifice (Cd for venturi is closer to 1 than is the orifice).
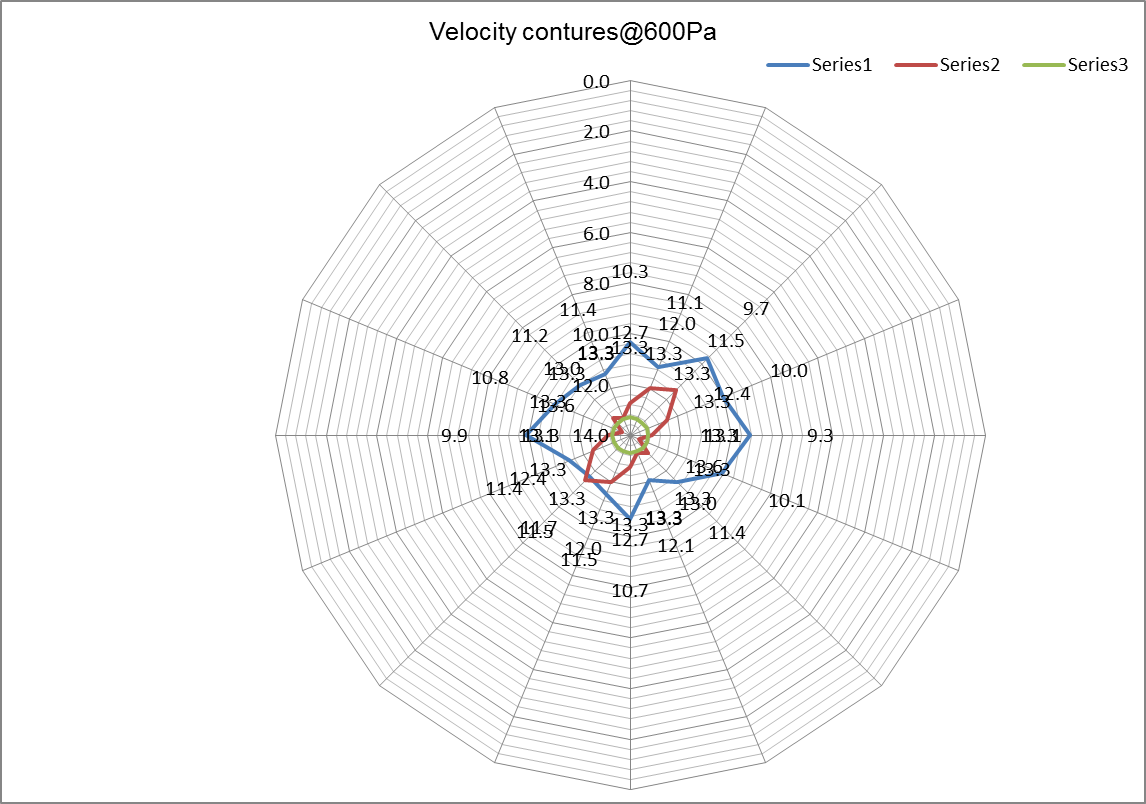
The velocity profiles above are important indicators on the type of flow the fluid is flowing. From the contours, we can tell that at 200Pa velocity pressure air was more streamlined than when at 600Pa velocity pressure. This is evident by the smooth contours in the first graph. The contours also show that the velocity decreases radially from the center. This is replicated in all the graphs. These contours also indicate that the velocity increases from 200Pa to 600Pa.
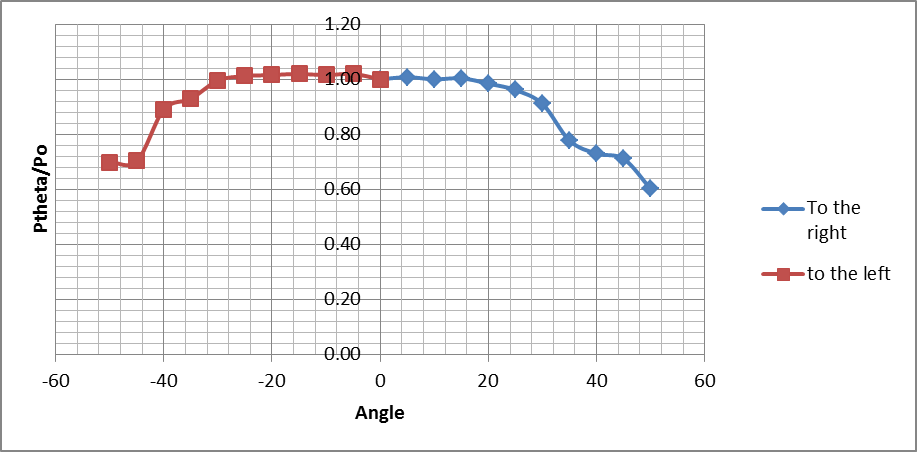
Errors caused by yawing of the pitot device are very important. Ideally, this happens when the probe of the device and the fluid stream intersect (not parallel). As per the graph above, the extent to which yaw can be accommodated for a 1% error in reading is approximately 20o.
Conclusion
The lab achieved its objectives with all the results displayed as shown in the figures above.
References
Chrisafis, A. (2007). Pitot-Static. Journal of fluid motion, 97 (90), 3-7.
Halliday, D., & Robert, R. (1997). Applications of the Bernoulli Equation. New York, NY: John Wiley & Sons.
Appendices
Table 1: temperature conditions of the room
Experiment 1
Table 2 showing pressure changes
Table 3: 5×5 grid pitot tube readings
Experiment 2
Table 3: showing pressure changes
Table 4: 5×5 grid pitot tube readings
Experiment 3
Table 5: showing pressure changes
Table 6: 5×5 grid pitot tube readings
Table 7: the effect of yaw @ 400Pa velocity pressure