Introduction
The outdoor playing environment forms a very fascinating experience for physicists since it presents a first-hand understanding of the basic principles behind physics. One such playing activity of interest is playing on a trapeze. Akin to a playing ground swing, the trapeze operates under the principles of driving a simple pendulum. A trapeze and a swing are the same things; however, the former incorporates a horizontal bar that is suspended by two parallel and vertical cords.
Invented eons back before the 19th century by Leotard, the trapeze presents a center of attraction to traveling circuses. It has gained considerable popularity of late since it elicits the adrenaline rush akin to what a bungee jumper experiences when sporting. To this end, circus events “such as Cirque du Soleil, found in Disney World, and the Millennium Show are gaining more interest, attracting performers from the world over” (Christiaan, 2007). Moreover, circus schools are becoming common in the major cities around the world e.g., New York and London. In South Africa, trapeze is a sport for the affluent who “are invited to the ‘trapeze parties’” (Christiaan, 2007).
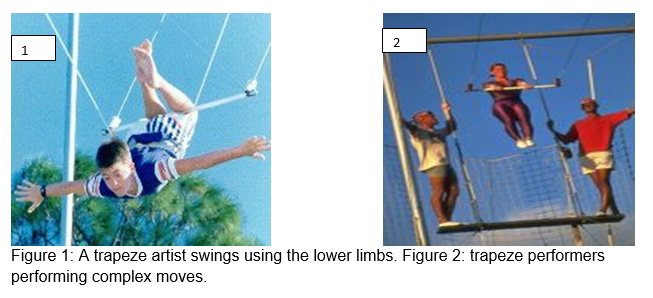
While sporting, the performers take breathtaking moves that leave the audience agape. From swinging using the arms, swinging by the use of the lower limbs (figure 1), to performing extremely complex flips (figure 2); trapeze presents an endless list of tricks. Given all the moves a trapeze artist can perform, the forces that keep the performer on the course are similar to what drives a simple pendulum. To this end, the term ‘simple’ may be deceiving since, while it is quite simple to predict the motion of a pendulum, it is quite difficult to perform an analytical analysis.
With this in mind, the rest of the literature will concentrate on the history behind this motion, establishing the theories that define it, to conclude with an experimental investigation to ascertain the principles behind the trapeze motion.
History
The principle behind both a trapeze and a simple swing is analogous to that of a pendulum. This principle was the brainchild of Galileo, a physicist whose idea was borne of a ‘swinging lamp’ used in the Cathedral back in the early 17th century. Galileo developed this idea while he was in Italy advancing with his studies at the university. In his investigations in the year 1602, “he discovered that the period of a pendulum is not affected by the amplitude” (Christiaan, 2007).
As such, he thought of incorporating this amazing discovery into a clock; however, he aborted the idea. Come 1965, this idea was incorporated into a clock with another scientist from the Dutch, Christiaan Huygens. His invention marked a major milestone in the science of timers albeit recording an error of sixty seconds per day. As such, he later worked on minimizing the clock’s error, which recorded an error of 10 seconds daily. Even though this was a major achievement; the big question that lingers in the minds of many is how Galileo developed an interest in the chandelier of the Cathedral.
According to some conjecture harbored by his student, Viviani, Galileo owes his interest in the persistent observation of a chandelier whenever he visited the church, only to discover that the period is always the same for a given pendulum irrespective of the angle of deflection. Another speculation is that his interests were derived from his study on the characteristics of musical instruments. The origin of his interest aside, how he came to establish that the period of a pendulum is constant over varying angles of deflection is what fascinates many.
Galileo and his students had to sit the whole day counting the number of oscillations to establish this fact. Consequently, he used this “to measure short periods (for example, in his inclined plane experiments), although it was still less precise than the ‘water clock’” (Christiaan, 2007). This can be explained by the fact that Galileo’s findings incorporated several errors, for instance, he assumed the effects of friction and angle sizes. As such, later experiments proved that Galileo’s findings only stand for angles less than 20o. Galileo tried to relate his findings to the law of fall, convincing many.
Even with all the debates that surrounded Galileo’s experiment, the principle behind the pendulum motion has a great influence on science. The pendulum exhibits a simple harmonic motion according to contemporary physicists since Aristotle’s findings. This is contrary to Galileo’s findings that purport a near-perpetual motion. Nonetheless, the principle behind the pendulum’s motion incorporates both “Galileo’s principle of inertia and the law of fall” (Milham, 1998).
According to Galileo, the pendulum motion is influenced by four forces- gravity, inertia and friction, centripetal force. While gravity pulls the mass of the bob towards the center of the earth, inertia sustains its state of motion. Consequently, friction brings the bob to rest. What makes a pendulum slightly different from the body on a free-fall is that it falls with varying acceleration.
Theory
The important forces behind the pendulum motion include gravitational force, centripetal force, frictional force, and inertia. However, the first two forces form the core of our discussion.
Force study of the pendulum
A pendulum motion is kin to a motion of a vibrating object. To this end, a vibrating object assumes a simple harmonic trend thanks to the restoring forces. Restoring forces’ behavior is interesting. This force varies with the position of the pendulum thereby influencing the speed of the bob as it makes an oscillation. Ideally, it impedes motion as the pendulum approaches the maximum displacement and accelerates the motion of the pendulum as “it approaches the equilibrium position” (Xue, 2007). In a pendulum, this force can be defined courtesy of the drawing below.
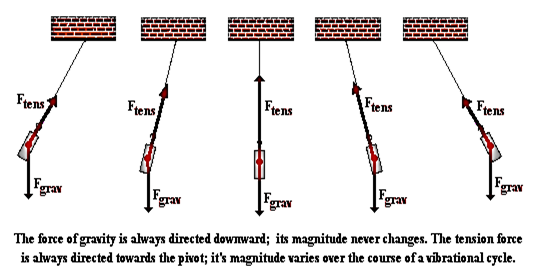
With the figure above we can resolve the forces plying on the pendulum to establish the restoring force as shown in figure 3 below.
From the figure above, the tangential component constitutes the restoring force since it’s the one pushing the bob to the central position. This is given by:
Therefore, when δ→0 , the displacement increases, and hence the restoring force increases. The opposite is true when δ→90 as the pendulum returns to its equilibrium position. At the equilibrium position, the Ftens experience maximum tension (maximum centripetal force).
Sinusoidal motion
When analyzing the pendulum motion, it is interesting to study both the position-time curve and velocity-time curve. A better understanding of this motion can be achieved by studying the figure below:
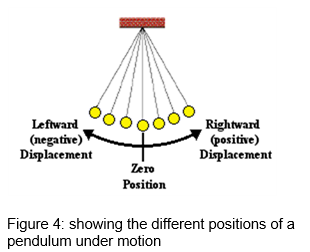
The pendulum moves about its equilibrium position until the motion fades away. When a graph of displacement is plotted against time, the below trend is observed:
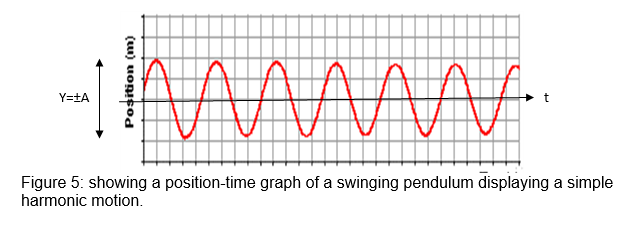
The horizontal axis coincides with the equilibrium position while the peaks of the curve represent the amplitudes. From the graph, it is evident that the trend assumes a sin curve otherwise a sinusoidal curve. Also, it is evident that the amplitude is decreasing gradually with time, only to fade later otherwise a simple harmonic motion.
As such, the frequency (f) = 1/T (T is the periodic time)
Therefore, the instantaneous position of the artist (y) is given as below:
Similarly, when the graph of velocity is plotted against time, the same trend is observed. The velocity gradually fades with time until the pendulum comes to rest (Figure 6). Just as is the equation above:
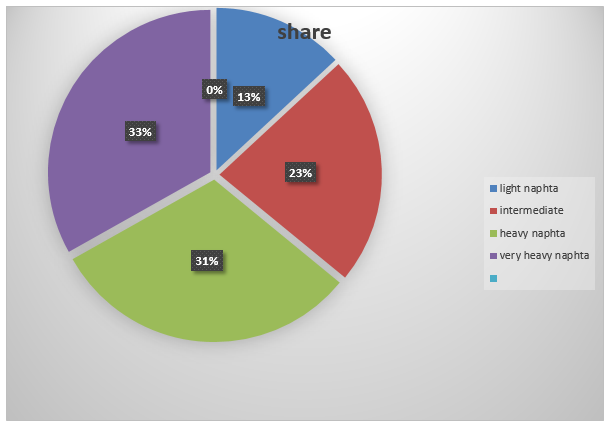
The peaks represent the pendulum position when the pendulum is momentarily at rest (v=0 m/s) (Weisstein, 2007).
Importantly, the equation linking the periodic time and the length of the graph was studied and found to be as below:
T = 2π√ (L/g)
Where, g is the gravitational field strength which is believed to be 9.81 m/s2 (Nave, 2006). As such, it is possible to ascertain the value of g when the other parameters are known.
Energy analysis
A pendulum that is under motion exhibits massive amounts of energy. The important energies that are present in a swinging pendulum include both the kinetic and the potential energies (PE). These two forms of energies exist at the same time although in different quantities. Basically, what happens is that energy is transformed between the two forms of energy i.e. from potential energy to kinetic energy (KE) and vice versa. Importantly, “the maximum PE occurs when the bob is momentarily at rest at its highest position” (Christiaan, 2007). On the other hand, the maximum KE is achieved when the bob is at the equilibrium position.
The potential energy is given by the formula below:
Where, m, g and h represent the mass, gravitational field strength, and height respectively. On the other hand, the KE is given as:
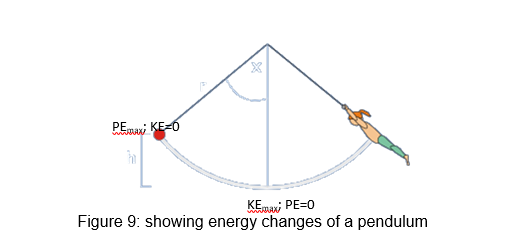
At the equilibrium position, we have maximum KE (PE= 0 m/s) (see figure 7). Ideally, the maximum PE has been converted to maximum KE. Therefore,
PEmax=KEmax
Thus;
(Vmax is the maximum velocity)
Therefore;
Investigation
In this investigation, we analyze the oscillation of a trapeze. Akin to the bob and the string, the trapeze artist represents the bob (figure 9). The main objective “of this experiment is to use a trapeze to determine the gravitational field strength of the earth” (Christiaan, 2007). Consequently, we can use this value to determine both the maximum KE and PE at their respective positions. This will enable us to determine the maximum velocity of the bob. Additionally, we can investigate the position-time graph to ascertain that they assume a sinusoidal trend.
Risk assessment
Equipment
- Timer
- String
- Clipper
- Bob (200 gms)
- Stand
- Protractor
- A meter rule
Procedure
The string was tied to the bob and then fastened to the stand to suspend. The string was then adjusted to 0.4 m, displaced to 15o, and then the bob was released to make the first 20 oscillations. Notably, the maximum height above the bench for experiment number 4 was recorded before the release of the bob. Also, the timer was switched on at the time the bob was released and finally stopped at the end of the twentieth oscillation. This procedure was repeated 3 times and the results were recorded. The same procedure was done for 0.6, 0.8, 1.0, and 1.2-meter lengths. A graph of T against L2 was then plotted to determine the frequency.
Results
The mass of the bob = 200±0.1gms or 0.2±0.0001 Kg
The length of the string was at an accuracy of ±0.01m.
The vertical height between the original position and when the pendulum was released was 0.25±0.01 m.
The maximum displacement of the equilibrium position was 0.1±0.01m,
Table1: shows the results obtained from the swinging pendulum.
Analysis
The graph of the period (T2) versus the square length (L) is shown below:
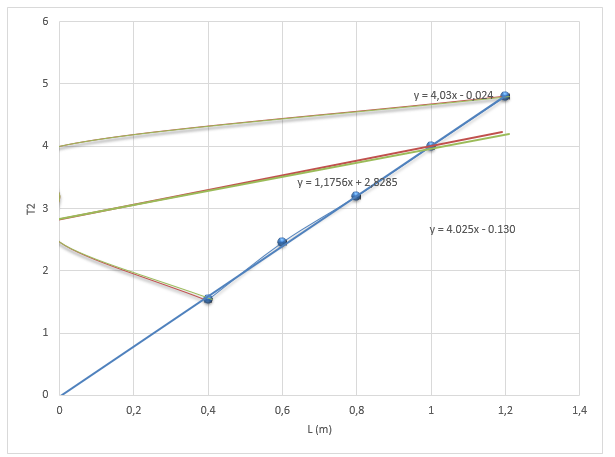
The maximum gradient is 4.075
The minimum gradient is 4.025
The line of best fit has a gradient of 4.03.
In a pendulum, T and L are related by the equation T =2π√ (l/g) or T2=4π2l/g.
Therefore, a graph T2 against L will give us a straight line with the gradient (m) 4π2l/g.
Thus, m= 4π2/g
Making g the subject formula: g = 4π2/m
The best value for the experiment will be given by the best line’s gradient 4.30.
Therefore, g = 4π2/4.3±uncertainity = 9.80±uncertainity m/s2
But uncertainty = (maximum gradient – minimum gradient)/2
The minimum value of gravity will be given by maximum gradient.
Therefore, g = 4π2/4.075 = 9.69 m/s2
The minimum value of the gravity will be given by minimum gradient.
Therefore.
g = 4π2/4.025 = 9.81m/s2
Hence, the error in the value = (9.69-9.81)/2 = ±0.06
Therefore,
g = 9.80±0.06 m/s2
With the value of g determined, we can now obtain the maximum PE (check figure 9). As such:
PE = mgh = 0.2×9.8×0.25 = 0.49±error J
Error = (PEmax-PEmin)/2 = (0.2001×9.86×0.251 – 0.1999×9.74×0.249)/2 = 0.005J
Therefore, PEmax = 0.49±0.005J
The maximum KE is equivalent to maximum PE. This is owed to the fact that all the energy is transformed from KE to PE at its maximum height. To this end, we are assuming the frictional force. Therefore,
KEmax = 0.49±0.005J
The maximum velocity occurs at the equilibrium position (fig. 9). Thus;
KE = 1/2mv2 = 0.49±0.005J
Therefore,
Vmax =√ (2 x 0.49/0.2) ± error m/s
Vmax = 0.99 ± error m/s
Error = (max – min) /2 = (2×0.495/0.1999 – 2×0.485/0.2001)/2 = 0.05J
Thus,
Vmax= 0.99±0.05 m/s
We can use the function ![]() to determine the instantaneous position of the curve as shown below:
to determine the instantaneous position of the curve as shown below:
Assuming that we are working on experiment number 4 (see table 1 above), f=1/T=1/2 = 0.5.
But A=0.1m
Therefore, when we replace the known terms into the equation we obtain:
y = 0.1sin (3.142t)
As such, we can obtain the variables y and t and then plot as below.
Table of results:
Table 2: showing the relative positions of the bob.

The graph displays amplitude (A) as 0.1m as expected. And since we assumed the air resistance, the graph exhibits a simple harmonic motion.
Conclusion
The investigation above achieved its expected objective. First, the value of the earth’s gravitational field strength obtained was almost accurate. It gave a figure of 9.80±0.06 m/s2 which is approximately equal to 9.81 m/s2. As such, there were minimal errors in the experiment. To this end, “a trapeze can be used to approximate the gravitational field strength of the earth” (Christiaan, 2007).
The energy analysis revealed the maximum PE and KE to be the same and equivalent to 0.49±0.005J. This holds provided the air resistance is null. However, this is not practically true since a pendulum cannot run forever. With the result, the maximum velocity obtained was 0.99±0.05 m/s. With regards to the position graph, the trend (a simple harmonic) was expected; however, this is true when there is no resistance on the bob. Otherwise, the pendulum will follow a near-simple harmonic motion (Halliday & Robert, 1997).
This investigation can be deemed a success since it generated minimal negligible error especially when the gravitational field strength was determined. Nevertheless, better results can be achieved courtesy of simulation-based experiments. With this, one can adjust the parameters effectively to yield accurate results.
References
Christiaan, H. (2007). Horologium Oscillatorium. Journal of mathematical works of the 17th and 18th centuries, 97 (90), 3-7.
Halliday, D., & Robert, R. (1997). Fundamentals of Physics. New York, NY: John Wiley & Sons.
Milham, W. (1998). Time and Timekeepers. New York, NY: MacMillan.
Nave, R. (2006). Simple pendulum. Journal of Hyperphysics, 109 (78), 6-7.
Weisstein, E. (2007). Simple Pendulum, Wolfram Research, 2 (79), 34-40.
Xue, L. (2007). Pendulum Systems: Seeing and Touching Structural Concepts. Journal of Engineering, 76 (98), 45-47.