ANOVA
Replication of Analysis
The statistical test. One-way analysis of variance (ANOVA).
The problem. The objective is to compare the libido of people who received a low dose of Viagra, a high dose of Viagra and those who did not take Viagra (received a placebo instead). The outcome of the experiment is libido, which is a dependent variable, whereas the different doses of Viagra are independent variables.
Research question. Does taking different doses of Viagra increase libido levels significantly?
Hypotheses
The null hypothesis is that the means of the three different groups are the same: H0: u1 = u2 = u3. The alternate hypothesis is that the means of the three different groups are different: HA: u1 ≠ u2 ≠ u3.
Results
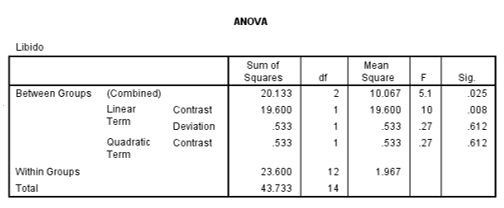
In Output 3, the row labeled “between groups” provides details regarding systematic variation due to the model (treatment) (Field, 2013). Conversely, the “within groups” row indicates unsystematic variations, which are disparities within the data because of inherent variances in libido and varied responses to Viagra. The F-ratio was 5.12, which had a significance of 0.025 thereby indicating that the effect of Viagra on libido was significant.
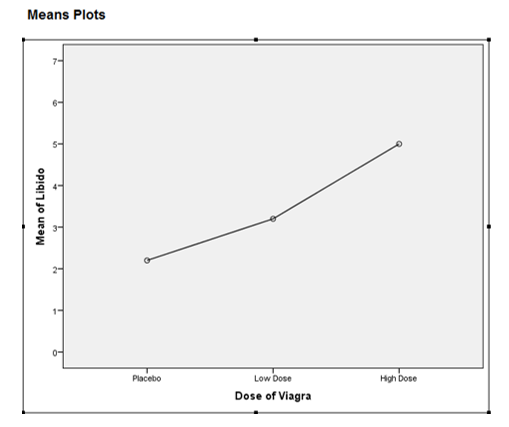
However, at this point, it is still unclear what the precise effect of Viagra is. The trend analysis attempts to explain the experimental effect to decide whether it can be accounted for by a linear or a quadratic relationship in the data (Carlson & Winquist, 2017). The F-ratio for the linear trend was 9.97 (p=0.008), which showed that as the dose of Viagra increased from zero to a low dose and finally to a high dose, the libido increased proportionally (Field, 2013).
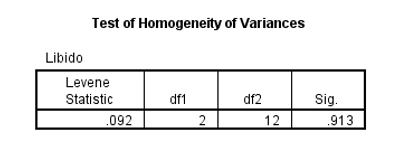
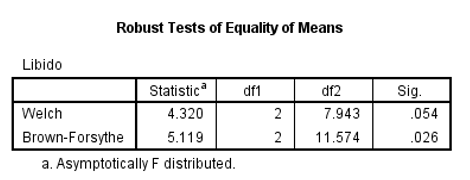
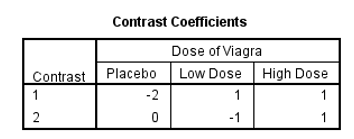
The F-ratio for the quadratic trend was not significant indicating that the relationship between Viagra dosage and libido did not follow a curvilinear trend. Output 5 shows the Welch’s and Brown–Forsythe F-ratios. Nevertheless, these readings were not useful because Levene’s test was not significant (Output 2). Output 6 indicates the planned comparisons for the Viagra data. Contrast 1 showed that taking Viagra led to a significant increase in libido compared to the control group (p = 0.029).
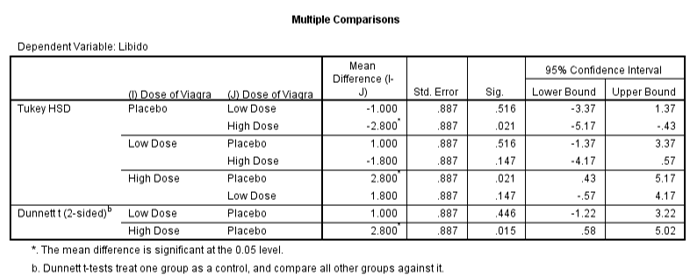
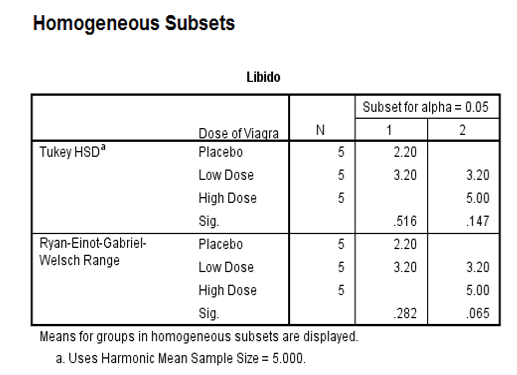
Contrast 2 showed that there was no significant difference in libido between groups that took a high dose of Viagra and a low dose of Viagra (p = 0.065). Tukey’s test showed that when the placebo group was compared to the low-dose group, the difference was not significant (p=0.516). However, when compared to the high-dose group, the difference was significant (p=0.021). Similar findings were evident from Games – Howell’s test.


Application of ANOVA on the Research Problem
Problem 1
What form of training is more effective in the training of staff members on the utilization of the equipment? Why?
The statistical test. One-way analysis of variance (ANOVA).
The problem
The objective is to compare the means of the level of utilization of equipment between staff members trained through a hands-on approach and those that underwent intensive classroom treatment. The outcome of interest is the utilization of equipment (dependent variable) while the two training modalities are the independent variables. There are only two levels of the independent variables: intensive classwork training (coded as 1) and hands-on training (coded as 2).
Research question
Is there a difference in the utilization of equipment between staff members trained through a hands-on approach and those that received intensive classwork training?
Hypotheses
The null hypothesis is that the means of the utilization of equipment between the two different groups are the same: H0: u1 = u2. The alternate hypothesis is that the means of the utilization of equipment between the two different groups are different: HA: u1 ≠ u2.
Results
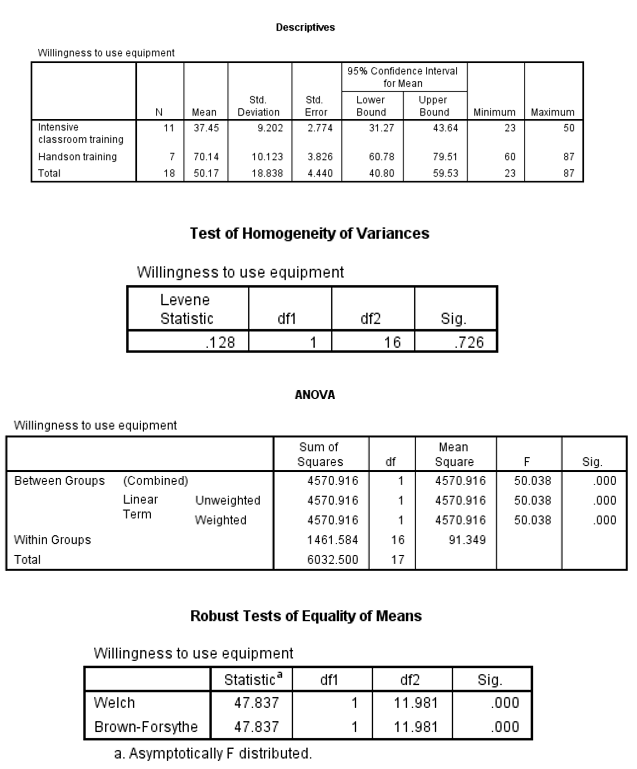
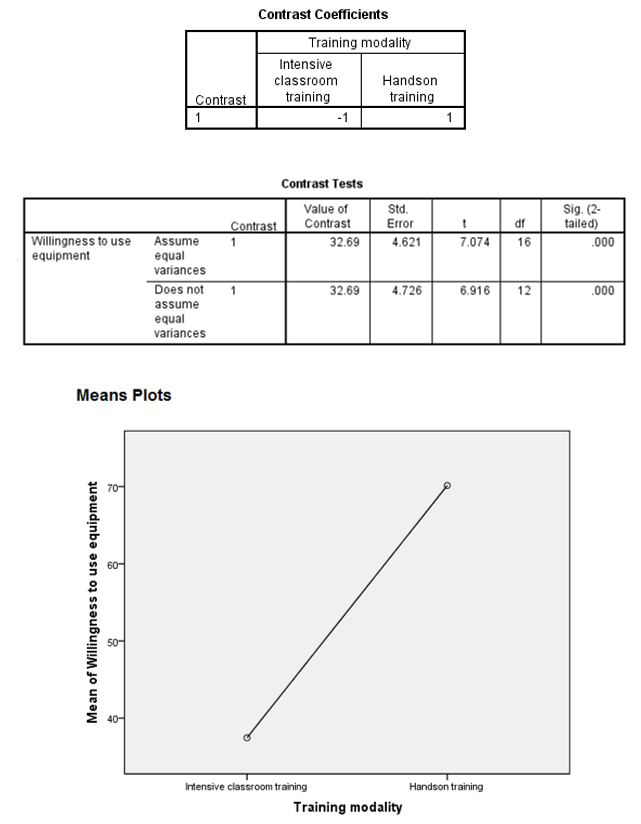
Levene’s test in the second output was not significant (p=0.726) thus showing that the variances between the groups were equal. In the third output, the row labeled ‘between groups’ provides the details of the effect of the model (training modality) on the use of equipment (SSM= 4570.916). The row labeled ‘within groups’ shows the unsystematic variation, which could be due to individual differences in using equipment (SSR= 1461.684).
The F-value was 50.038, which was highly significant (p˂0.001). This value indicated that there was a significant difference in the utilization of equipment between staff members trained through intensive classwork and hands-on training. The Welch’s and Brown–Forsythe F-ratios were not applicable because the variances between the groups were equal as shown by Levene’s test (Terrell, 2012). Post hoc tests are not computed when there are less than two groups (Hahs-Vaughn & Lomax, 2013). Therefore, post hoc outputs were absent.
Problem 2
How does the intervention correlate with the frequency of the use of technology, patients’ satisfaction, as well as the quality of services provided?
The statistical test. One-way analysis of variance (ANOVA).
The problem
The aim of the problem is to compare the means of the frequency of technology use, patient satisfaction, and the quality of services provided between staff members trained through a hands-on approach and those that underwent intensive classroom training.
Research question
Is there a difference in the frequency of technology use, level of patient satisfaction, and the quality of services provided between staff members trained through a hands-on approach and those who received intensive classwork training?
Hypotheses
The null hypothesis is that the means of the frequency of technology use, level of patient satisfaction, and the quality of services provided between the two different groups are the same: H0: u1 = u2 = u3. The alternate hypothesis is that the means of the frequency of technology use, level of patient satisfaction, and the quality of services between the two different groups are different: HA: u1 ≠ u2= u3.
Results
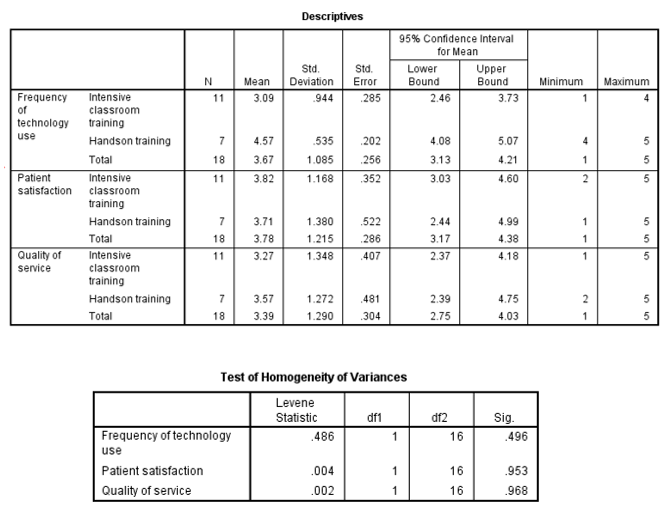
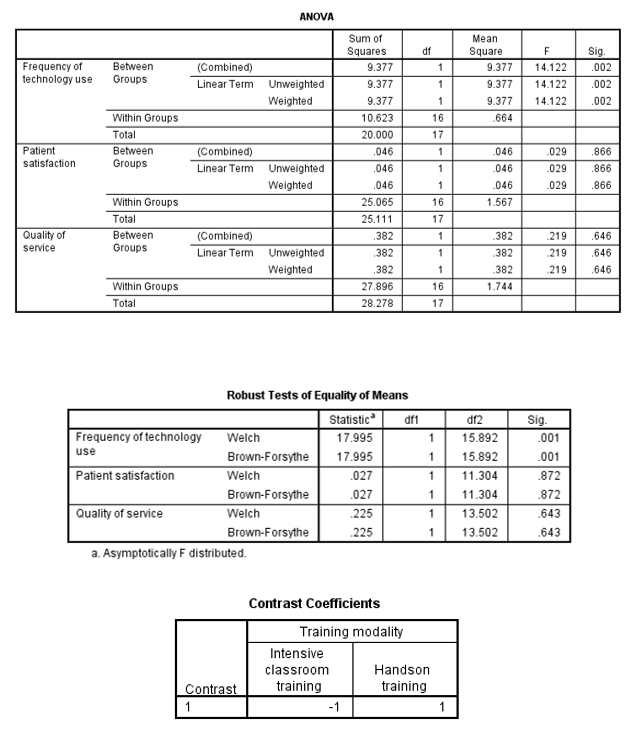
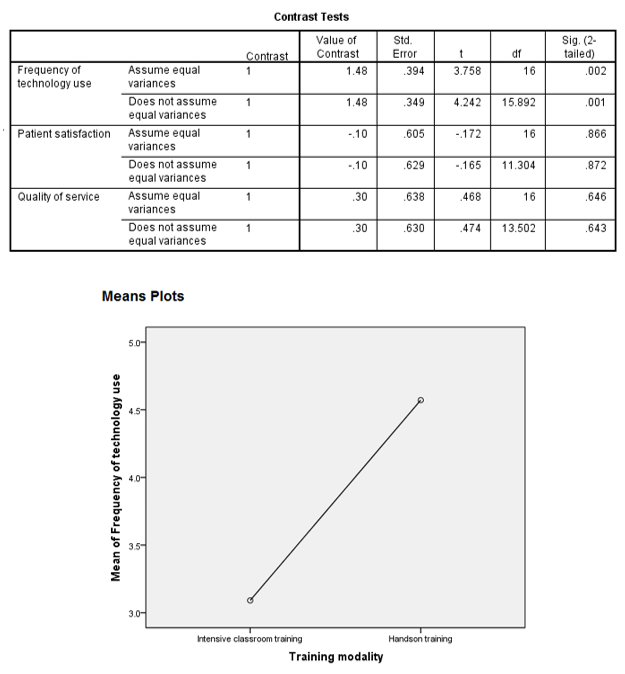
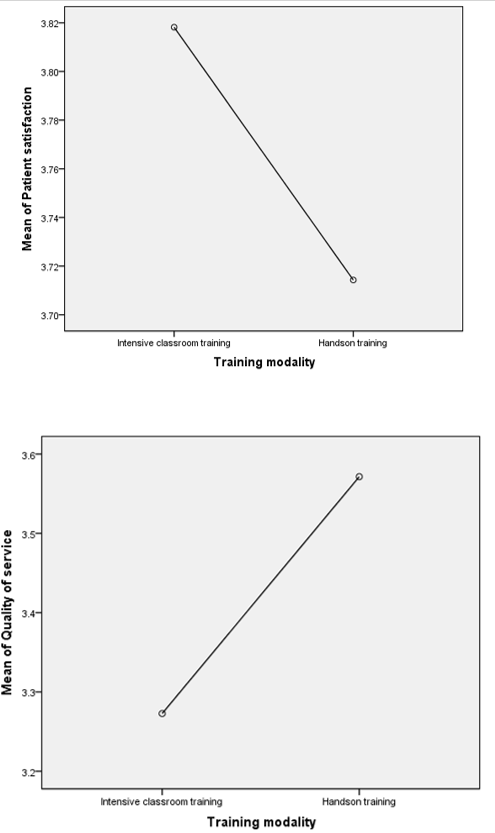
Levene’s test was not significant for the frequency of technology use (p=0.496), patient satisfaction (p=0.953), and the quality of services (p=0.968). Therefore, the variances between the groups were equal. The F-value for the frequency of technology use was 14.122, which was highly significant (p= 0.002). However, the level of patient satisfaction and the quality of services provided between the two groups were not significant with F= 0.029 (p˃0.05) and F=0.029 (p˃0.05) respectively.
The Welch’s and Brown–Forsythe F-ratios were not applicable because the variances between the groups were equal as shown by Levene’s test. Post hoc tests were not computed because there were less than three groups (Jackson, 2012).
Problem 3
How does the intervention affect the participants’ willingness to implement their own research or find new ways of utilizing the equipment?
The statistical test. One-way analysis of variance (ANOVA).
The problem
The outcome of interest is the effect of the training on participants’ willingness to implement their own research or find new ways of utilizing the equipment.
Research question
Is there a difference in the subjects’ willingness to implement own research and the capacity to find new ways of utilizing of equipment between workers trained through a hands-on approach and those trained through intensive classwork training?
Hypotheses
H0: u1 = u2. The alternate hypothesis is that the means of the two different groups are different: HA: u1 ≠ u2.
Results
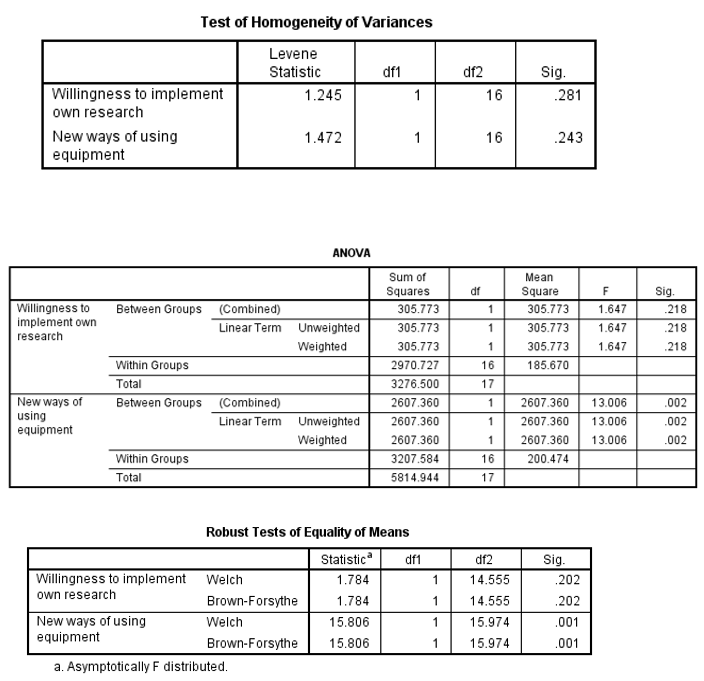
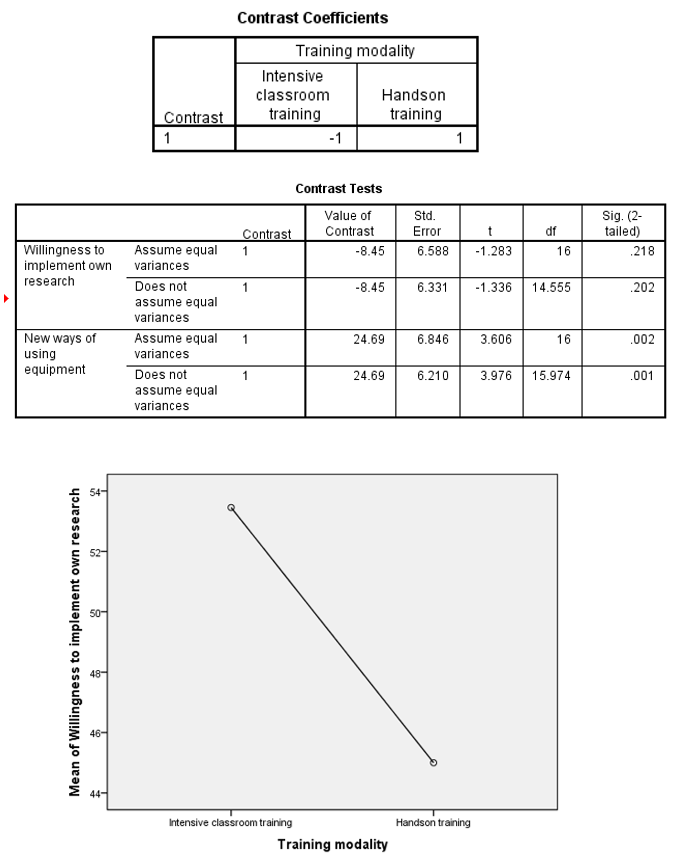
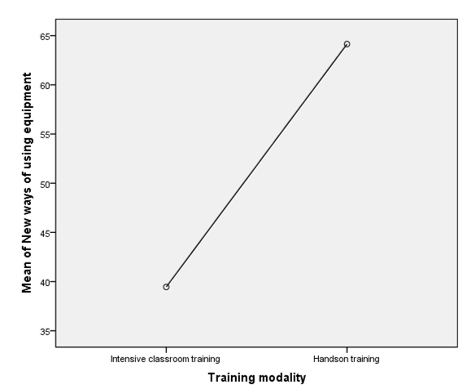
Levene’s test was not significant, hence all the variances were equal. The willingness to impellent own research between the two groups was not significant (F-value= 1.647, p= 0.218). However, the capacity to find new ways of utilizing equipment was significant between the two groups (F-value= 13.006, p=0.002). Post hoc tests were not computed for because there were less than three groups as indicated by Elliott and Woodward (2014).
Problem 4
How does the intervention affect the participants’ willingness to affect the hospital’s performance as well as certain purchasing policies?
The statistical test. One-way analysis of variance (ANOVA).
The problem
The goal is to compare the means of the willingness to affect the hospital’s performance as well as certain purchasing policies between staff members trained through a hands-on approach and those that underwent intensive classroom training.
Research question
Is there a difference in the willingness to affect the hospital’s performance as well as certain purchasing policies between employees trained through a hands-on approach and those trained through intensive classwork training?
Hypotheses
H0: u1 = u2; HA: u1 ≠ u2.
Results
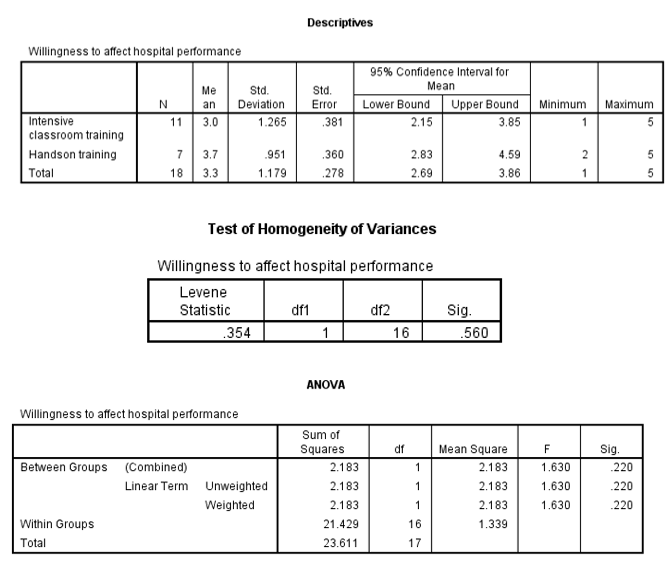
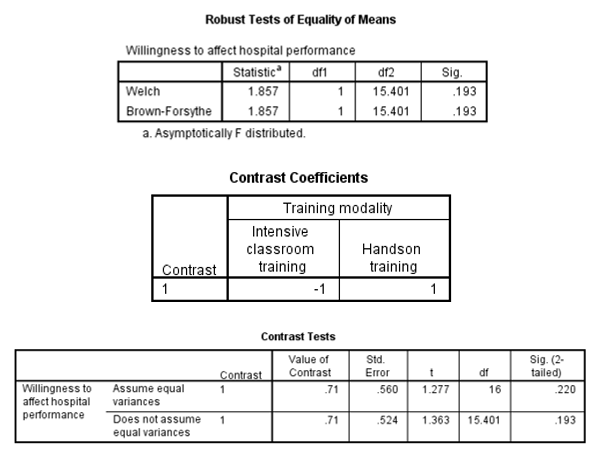
Levene’s test was not significant (p=0.560). The F-value was 1.63 (p=0.220), which was not significant. This value implied that the difference between the willingness to affect the hospital’s performance as well as certain purchasing policies between employees trained through a hands-on approach and those trained through intensive classwork training was not significant. Post hoc tests were not computed because there were fewer than three groups.
References
Carlson, K. A., & Winquist, J. R. (2017). An introduction to statistics: An active learning approach. Los Angeles, CA: Sage Publications.
Elliott, A. C., & Woodward, W. A. (2014). IBM SPSS by example: A practical guide to statistical data analysis (2nd ed.). Thousand Oaks, CA: Sage Publications.
Field, A. P. (2013). Discovering statistics using IBM SPSS statistics. Web.
Hahs-Vaughn, D. L., & Lomax, R. G. (2013). An introduction to statistical concepts (3rd ed.). New York, NY: Routledge.
Jackson, S. J. (2012). Research methods and statistics: A critical thinking approach (4th ed.). Belmont, CA: Cengage Learning.
Terrell, S. R. (2012). Statistics translated: A step-by-step guide to analyzing and interpreting data. New York, NY: Guilford Press.