Introduction
Vodafone Group Plc is a company based in England; it provides telecommunication services and operates worldwide. The company is listed in the London Stock exchange primarily but has a secondary listing on Nasdaq. This paper has analyzed the financial reports of the company, compared it with its peers, and evaluated the risks of investing in Vodafone Plc.
On the ratio analysis, four types of ratios were analyzed: solvency, profitability, valuation, and liquidity ratios. For solvency ratios, the debt-to-equity analysis found that Vodafone was in the safe zone. ROE is the profitability ratio that was analyzed; it revealed abysmal performance from the company.
Valuation ratios such as PB showed that Vodafone had a low return on equity and assets. Efficiency ratios analyzed were asset turnover, where Vodafone was found to have a moderate rate of converting assets to revenue. A look at the company’s financial statements showed that, ironically, 2020 was a better year for them than 2019 and that the company could be in a better position to recover from the effects of the pandemic.
In comparing it with its peers, it was revealed that the rosy 2020 results were not an industry-wide phenomenon. It also revealed that its ratios are within tolerable industry averages. On the valuation of its stock, Vodafone stock is a buy since it has been on sideways movement for quite some time and is doing some restructuring that could increase its revenue.
Company Overview
Vodafone Group Plc is a telecommunications company from the UK with headquarters in Newbury, England. Some of the regions in which it operates include Africa, Asia, Europe, and Oceania; the company operates in 20 countries as of 2020 and has partnerships in 48 others (“Vodafone”). Vodafone Global Enterprises is the organization’s global division and provides IT and telecommunication services to more than 150 clients. Vodafone’s primary listing is the London Stock exchange where it is part of the FTSE 100; it also has a secondary Nasdaq listing.
Vodafone employs over 93,000 people as of 2020, and its CEO is Nick Read, while Jean-Francois Van Boximeer is the chairperson (“Vodafone”). The company reported €44.974 billion in revenue, €4.099 billion operating income, €455 million in net income, and €62.625 billion in total equity (“Vodafone Group Income”). This paper will look at the company’s financial reports, compare them with its peers and evaluate the risks associated with investing in them.
Vodafone has seen a lot of developments lately and is in the process of listing its mast division. As of March 31, 2021, Vodafone stock was trading at £132.66 with a volume of 18.563 million (“Vodafone Group Historical”). Over the past 52 weeks, the highest stock price was £142.44, while the lowest was £87.11 (“Vodafone Group Historical”). The company is said to initiate another stock buyback program over the coming year.
The company has already arranged with Morgan Stanley to launch the buyback that is supposed to be launched on March 22th. The company has allocated £330 million for the plan and the number of ordinary shares to be bought should not be more than 256.8 million (“Vodafone Group Historical”). Vodafone’s Vantage Towers is set to launch an IPO with a revised price range of between 24 and 25 Euros, according to the bookrunner (“Vodafone Group News”).
Vodafone projects to raise $3.3 billion from the towers listing. In Italy, Vodafone is seeking €1.1 billion from damages after the country’s competition watchdog ruling over market abuse allegations (“Vodafone Group News”). Nevertheless, under infrastructural news, France’s Orange is said to seek more partnership with its European counterparts Vodafone and Deutsche Telekom after the firm exited the towers business.
Ratio Analysis
Solvency Ratios
Solvency ratios measure an organization’s ability to meet its long-term debt obligations. The metrics are used mainly by prospective lenders of the company. As of March 2018, Vodafone Plc had a debt-to-equity ratio of 1.12, which increased to 1.25 in March 2019 and further to 1.69 as of March 2020 (“Vodafone Key Metrics”). This means that the company was using more debt to finance its operations. The ratios are consistently above 1.00, indicating that they had multiple years where long-term debt was more than shareholders’ equity. This means that if they were to liquidate, they would struggle to pay their debts.
Profitability Ratios
Profitability ratios are financial ratios used to assess a business’s ability to generate revenue compared to its assets, costs, and shareholder’s equity. As of March 31, 2021, Vodafone had a Trailing Twelve Months ROE of 1.89 and an annual Return on Assets of -0.28. ROE indicates a company’s ability to turn equity into income; 12%-15% ROE is considered desirable. Vodafone had an abysmal result with 1.89 ROE (“Vodafone Key Metrics”). It also had a negative ROA indicating a negative rate of turning assets into income.
Valuation Ratios
Valuation ratios indicate the attractiveness of a company to investors. The stock price of a company defines its valuation. Vodafone had an annual Price to Book (PB) ratio of 0.68, Price to Earnings (PE) excluding extra items of nil; the same metric for TTM was 18.23 (“Vodafone Key Metrics”). The company had a nil EPS because of low EPS. The PB ratio indicates that the company’s market capitalization is a fraction of the actual value of assets minus liability; this shows that Vodafone has low returns on equity and assets. However, the ratios do not say much unless analyzed historically to deduce a trend or compared to industry peers to indicate outliers.
Efficiency Ratios
Efficiency ratios indicate a company’s internal usage of assets and liabilities. They are also called activity ratios; they analyze receivables turnover, liabilities repayment, usage of equity, and inventory usage. Vodafone Plc had an annual asset turnover of 0.29, a TTM asset turnover of 0.28, an annual inventory turnover of 47.24, and an annual receivables turnover of 5.75 (“Vodafone Key Metrics”). An asset turnover of 0.29 shows a moderate rate of converting assets into revenue (“Vodafone Key Metrics”). The ratios are best compared horizontally or against industry peers.
Liquidity Ratios
Liquidity ratios are financial ratios that indicate a company’s ability to meet its debt obligation without needing to raise external capital. Examples of liquidity ratios are the current ratio and quick ratio. From the latest financial report, Vodafone has a current ratio of 1.01 and a quick ratio of 0.99 (“Vodafone Key Metrics”). The two ratios calculate short-term debt against current assets, but the quick ratio excludes inventory in its calculation. The two results show that Vodafone is in a safe position since even for the more dire quick ratio, they have 99 cents worth of current assets to pay off their current debts.
Financial Information and Valuation
Income Statement

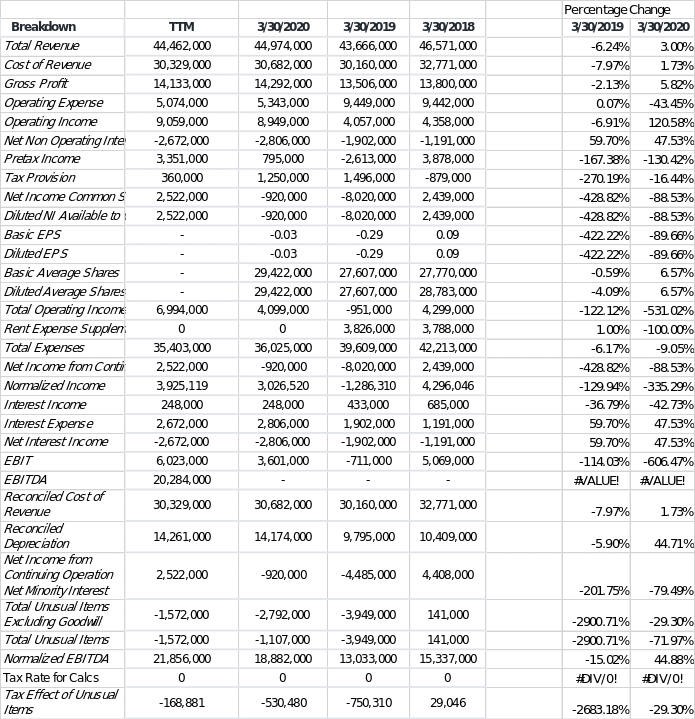
From figure 1 above, total revenue decreased by 6.24% in 2019 but increased by 3% in 2020. This drop in revenue was accompanied by a similar trend in gross profit which had decreased by 2.13% in 2019 but had increased by 5.82% in 2020. The revenue figures further support the operating expense figures, which had remained relatively constant in 2019 – only increasing by 0.07% – but had dropped by 43.45% in 2020.
In 2019, Vodafone had posted a 6.91% drop in operating income, but this had increased by 120.58% in 2020. Pre-tax income had plunged by 167.38%% in 2019, and further continued to slump by 130.42% in 2020. Net income had dipped in both 2019, and 2020 posting drops of 428.82% and 88.93%; noteworthy, 2019’s fall was far more dramatic than that of 2020. Basic EPS was 0.09 in 2018, -0.29 in 2019, and -0.03 in 2020.
Balance Sheet

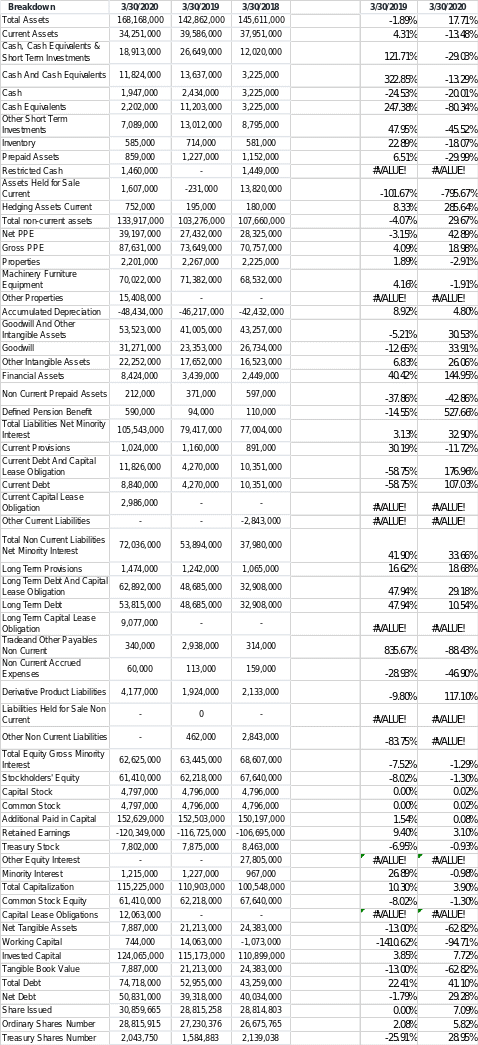
From figure 2, there was a dip in total assets in 2019 by 1.89%, but an increase occurred in 2020 by 17.71%. Current assets increased by 4.315 in 2019 but plunged by 13.485 in 2020. Current debt had dropped by 58.75% in 2019 but had risen by 107.03% in 2020. Long-term debt had increased by 47.94% in 2019 and increased further by 10.54% in 2020 (“Vodafone Balance Sheet”).
2020 was a bad year for the global economy, where most companies posted losses. However, although 2020 was not a stellar year for Vodafone, it seems to have been a better year than 2019. In 2019, the company had reported a drop in revenue, gross profit, increased operating expense, decreased operating income figures which had shown opposite patterns in 2020. On the balance sheet, total assets had dipped in 2019 but increased in 2020.
It is not exactly clear why Vodafone had a good year in 2020 during a raging pandemic, but the explanation could be that they were recovering from a bad year in 2019 caused by other reasons unrelated to COVID-19. Thus, when they corrected the internal problem, the pandemic could not have had a worse effect than their issue in 2019. Another likely explanation is that it was a good year for telecommunication companies since most people worked from home, creating demand for communication products. The prediction for 2021 results is increased income since the world is recovering from COVID-19.
Comparison with a Peer
It has been established that Vodafone had a good year in 2020 despite the pandemic. It would be interesting to compare the results with those of its peers. This section will compare Vodafone’s statements with those of American telecommunication giant AT&T. Report show that the US firm increased revenue by 6.11% in 2019 but dropped by 5.125% in 2020 (“30 Year Financial”). According to “Vodafone Income,” gross profit had risen by 6.26% in 2019 but plunged by 5.375 in 2020. Operating income, on the other hand, had increased by 12.515 in 2019 but dropped by 14.03% in 2020.
Although net income had plunged by 28.22% in 2019, it had slumped by 137.23% in 2020. In 2019, EPS was 1.90 but was -0.75 the following year (“30 Year Financial”). On the balance sheet, AT&T had reported a 6.48% increase in total current assets in 2019, but this had dipped by 5.03% in 2020. Total assets also had increased by 3.72% in 2019 but decreased by 4.7% in 2020 (“30 Year Financial”). There was an increase in total liabilities by 3.485 in 2019 but a dip by 0.92% in 2020. Total shareholders equity had only increased by 0.07% in 2019, but the same plunged by 12.24% in 2020 (“Vodafone Balance Sheet”). The company seems to have followed a different pattern from Vodafone.
In terms of ratios, AT&T’s ROE for 2020 was -3.10%, while the ROA was -0.96%. AT&T had a PB ratio of 1.27 and a PE ratio of 0.00 (“30 Year Financial”). For liquidity ratios, AT&T had a quick ratio of 0.82 and a current ratio of 0.82; Vodafone had better liquidity ratios than AT&T, meaning they’re in a better position to handle their short-term debt obligations. AT&T also had a debt-to-equity ratio of 1.1, which is eerily similar to that of Vodafone at 1.12 (“30 Year Financial”).
From the above comparisons, it is clear that Vodafone having a good year in 2020 was not an industry-wide phenomenon but rather an exception. A lot of financial ratios do not make enough sense by themselves unless compared horizontally or against peers; from the results of comparing Vodafone’s results with those of AT&T, one can conclude that Vodafone is not strikingly different from its peers and is performing well.
Stock Valuation

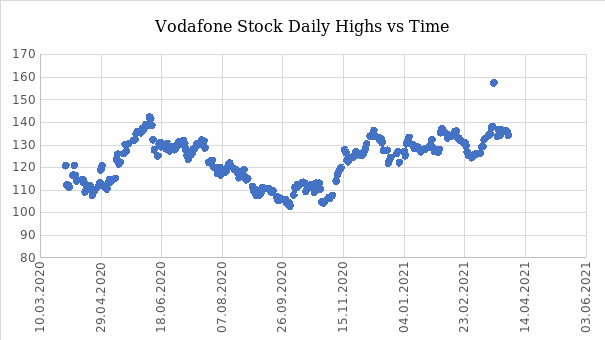
Above, figure 3 shows a plot of Vodafone’s stock highs against time for one year. The graph shows an increase of the stock price up to a local high of 141 on September 6, 2020; the stock then corrects to a low in the region between 103 and 113 around November 6, 2020 (“Vodafone Group Historical”). From November, the stock has been rising to a high of 136 on December 10 (“Vodafone Group Historical”).

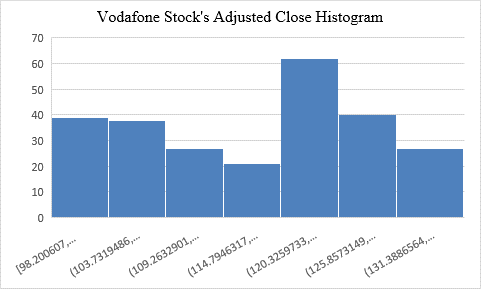
Since then, the stock has been moving sideways with no notable positive or negative correlation if a line of best fit were to be drawn. Figure 4 above represents Vodafone stock prices adjusted close for a period of 1 year from April 2020 to April 2021. The histogram indicates that the price is not normally distributed. It shows that the price is skewed to the left on the lower side.
The asymmetrical distribution indicates that the stock is volatile. Historically, Vodafone seems to have had a better past and has all the signs of a struggling giant. For example, their shares peaked at about £403 at the turn of the millennium, although the spike did correct quickly, going back to the 140 range in 2 years (“Vodafone Group Historical”). The company’s stock price has been on a sideways movement for over a decade, although it did rise for some time peaking at £247 in 2014 when their profits were also increasing (“Vodafone Group Historical”). The pattern from 2017 is a downtrend which is discouraging for investors, but it seems to have bottomed.
Dividend Discount Model Valuation
Divided Discount Model (DDM) is a quantitative mechanism of valuing the stock of a company. The formula is:
V0 = DPS / (r – g)
Where:
- V0 – Current fair value of a stock
- D1 – The dividend payment a year from now
- r – The estimated cost of equity capital (usually calculated using CAPM)
- g – The constant growth rate of the company’s dividends for an infinite time
In this calculation, there have to be assumptions:
- EPS TTM = 0.077
- Dividends Per Share = 0.08
- Assumed Growth rate = GDP growth of UK economy = 1.9%
- Cost of Equity = 4.27%
- DPS = £0.08 x 1.9% = £0.0816
- V = £0.0816/ (4.27%-1.9%) = £34.43
The weighted average cost of capital is equal to the cost of equity with the assumption that Vodafone has 100% equity capital. The result above indicates that Vodafone group, currently trading at £135, is overpriced. Because the value is overpriced, this shows that financial advice regarding Vodafone stock is a sell. However, this metric alone is not all it would take to invest/divest in a company since many factors are usually considered.
Debt Free Cash Free Valuation
Vodafone DFCF = Market Cap + (Preferred Stock + Long-Term Debt & Capital Lease Obligation)
= £37.47 B + £64.07B
= £101.54 B
Debt Free Cash Free is a type of valuation that assumes that if a company were to be sold, the valuation of the company is the enterprise value, and the seller would take responsibility for all their debt and all their cash. DFCF valuation is similar to the enterprise value of a company. The assumptions for this valuation are that the company has no debt and no cash. The interpretation for the above value is that the market capitalization for Vodafone is £37.47B, but since DCFC valuation assumes that the company has no debt and no cash, these are added to the market cap to obtain the enterprise value.
Risks of Investing in Vodafone
The risks of investing in Vodafone arise from the global economy’s outlook as it continues to recover from the COVID-19 pandemic. It is becoming evident that the pandemic will change the world forever with the possibility of unrecoverable damage to the world economy.
Vodafone is a global company that operates in many countries, including developing ones, many of which do not seem to have the pandemic under control. Vodafone may have some respite after the withdrawal of France’s Orange from tower business, leaving a wider market for them. The company is looking to list its Vantage Towers business and raise some money to offset piling debt. Investors should be cautious about investing in companies that are selling their segments to generate cash. This means that the concerned organization may have engaged in mindless expansionism that has misfired and is looking to correct its errors.
Conclusion
This paper has looked at Vodafone Group Plc, a publicly traded telecommunication company based in the UK. From the company’s profile, it is evident that they are a gigantic company with a global footprint. From the financial analysis, it is clear that the company has been struggling for the past decade. It seems like a classic case of legacy companies that expanded heavily but are now bloated.
Works Cited
“30 Year Financial Data of AT&T Inc.” Guru Focus, Web.
“Jio and Airtel Consolidating Market Share; Vodafone Idea Likely to Lose RMS. ” Business Today, 2020, Web.
“Vodafone.” Companies History, Web.
“Vodafone Group PE Ratio 2006-2020”. Macrotrends, Web.
“Vodafone Group Plc. News ” Reuters, Web.
“Vodafone Group Plc. Key Metrics” Reuters, Web.
“Vodafone Group Plc. Balance Sheet” Yahoo Finance, Web.
“Vodafone Group Plc. Income Statement” Yahoo Finance, Web.
“Vodafone Group Plc. Historical Data” Yahoo Finance, Web.