Dividend Policy Overview
The company’s dividend payout ratio has been growing steadily over the past three years. In 2020, the dividend payout ratio was 29%, while it was only 20.4% in 2018 (Volkswagen AG, 2018; 2020). This tendency can be explained by Volkswagen’s commitment to reach the dividend payout ratio above 30% by 2025 (Volkswagen AG, 2020). The company accepted this goal in 2015 and has been steadily increasing the payout ratio since that time.
At the same time, the suggested dividend per share policy was €4.8 in 2018, €6.5 in 2019, and €4.8 in 2020 (Volkswagen AG, 2018; 2019; 2020). As a result, the dividend yield in 2020 was 2.8%, 3.8% in 2019, and 2.4% om 2018 (Volkswagen AG, 2018; 2019; 2020). These fluctuations can be explained by the changes in the company’s net income (Yahoo Finance, 2020). Since the company experienced a slight decrease in net income in 2020, it decreased its dividends to the level of 2018 to ensure steady growth of dividend payout ratio. The company did not have any major stock repurchases or splits during the past three years.
Comparison to Major Competitors
Volkswagen’s dividend policy was one of the most attractive for the investors based on comparison with market leaders. Table 1 below provides a comparison of Volkswagen’s dividend policy to Ford, Toyota, and General Motors in 2020. The analysis demonstrates that Volkswagen’s dividend policy was very close to the dividend policy of Toyota. Toyota has been keeping the dividend payout ratio above 30% for the past three years, which was the goal for Volkswagen AG. Dividend yields of General Motors, Toyota, and Volkswagen were similar, which puts these companies in line in terms of attractiveness.
Table 1. Competitors’ Dividend Policy.
Note: The chart was prepared using the information of the companies’ annual reports (Ford Motor Company, 2021; General Motors, 2021; Toyota, 2021; Volkswagen AG, 2021).
Dividends and Earnings
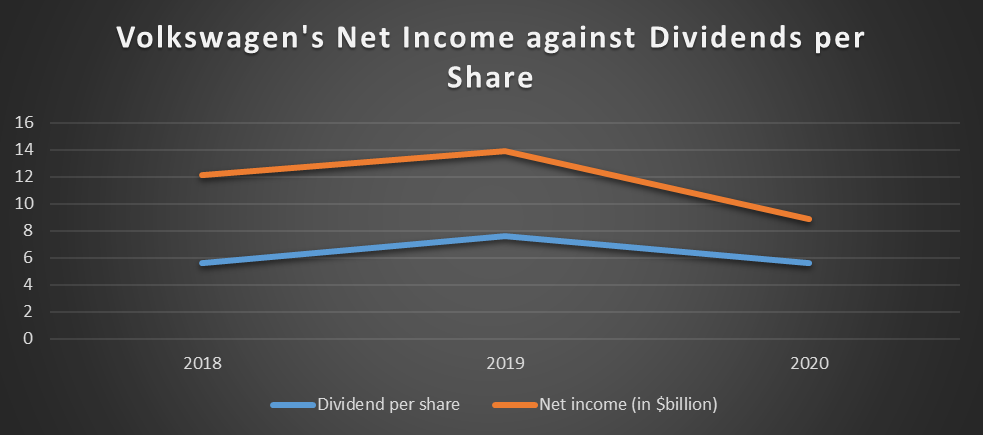
There are different theories that explain incentives for paying dividends. Common theories are residual, traditional, irrelevancy, optimal dividend policy and relevancy theories (Clive, 2012). In order to understand if there was a correlation between the dividend policy and earning, the company’s net income was plotted together with the dividend per share for the past three years (see Figure 1). The analysis demonstrates that there is a significant correlation between the two matters; however, it is not direct. This tendency can be explained by the optimal dividend policy theory (Clive, 2012). The company aims at reaching the dividend payout ratio of 30% by 2025. This value may be assumed as the optimal dividend policy. Thus, the company regulates its dividend per share policy based on the expected dividend payout ratio. Since the dividend payout ratio depends on net income and total dividends paid, it regulates its dividend per share.

References
Clive, M. (2012). Financial management for non-financial managers. Kogan Page.
Ford Motor Company. (2021). Annual report 2020. Web.
General Motors. (2021). Annual report 2020. Web.
Toyota. (2021).Annual report 2020.Web.
Volkswagen AG. (2019). Annual report 2018.Web.
Volkswagen AG. (2020). Annual report 2019. Web.
Volkswagen AG. (2021). Annual report 2020. Web.
Yahoo Finance. (2021). Volkswagen AG. Web.