- Introduction
- Coca-Cola Five Years Stock Chart
- Coca-Cola Company’s Dividend Policy
- Sustainability of the Increasing Dividend Policy
- Estimating the Future Growth of Dividend
- Competitive Advantage and Return on Equity (ROE)
- Debt and equity
- Relation to the shareholder wealth maximization
- Conclusion
- Reference List
Introduction
Coca-Cola Company (KO) is the global leader in the beverage industry. The company has interests in soft drinks, juice, coffee and tea, energy drinks, and water among others. Founded in Atlanta, the company has been operational for more than nine decades and is currently one of the most profitable ventures in the global consumer goods sector. However, profitability has been affected by health concerns, which have reduced the demand for some of its products. The company has been consistent in paying dividends each year since 1920. From the year 1963, the company has adopted an increasing dividends policy quarterly. At present, the dividend reliability of Coca-Cola is relatively higher than for other companies operating in the same sector. Besides, the company has a strong dividend up-trend with a very attractive over yield (Atrill & McLaney 2008). In the last five years, the dividend per share has risen steadily from $0.23 in the first quarter of the year 2011 to $0.33 in the second quarter of the year 2015. In the four quarters of the year 2011, the dividend per share was $0.23 followed by $0.26 in 2012 and $0.28 in the year 2013. The dividend per share increased to $0.30 in the year 2014 and $0.33 in the year 2015. This paper will present the theoretical perspective of dividend policy announcements of Coca-Cola for the last five years concerning the development of the generation of shareholder wealth.
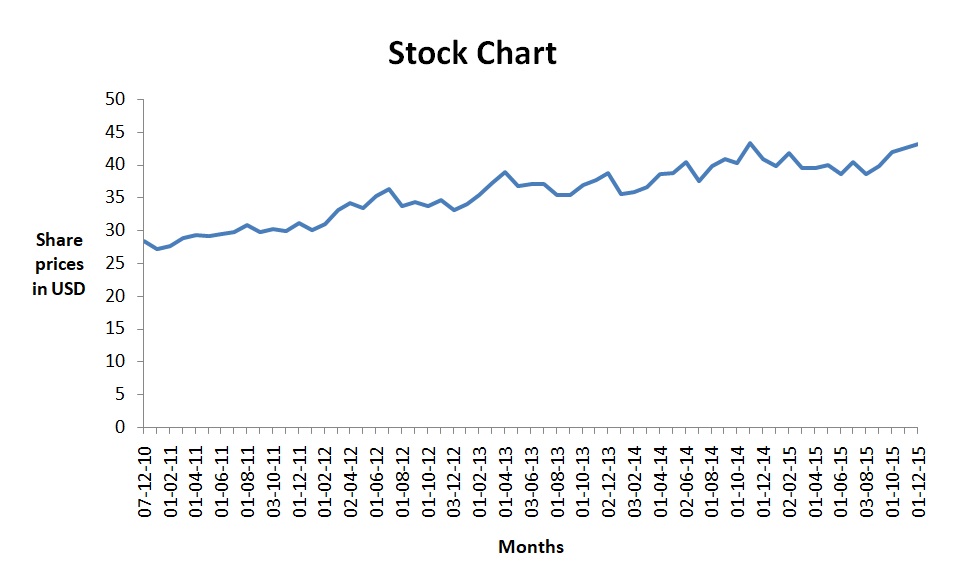
Coca-Cola Five Years Stock Chart
The stock of Coca-Cola has been on the rise since 2011 with an average return of 4.4%. Specifically, considering the total dividend paid for the five years is $1.01, the total annual average return is 6.2%. This means that the average dividend return is 1.8%. The table presented below shows the monthly stock prices of the company for the past five years.

Growth in revenue per share and earnings per share in the last five years
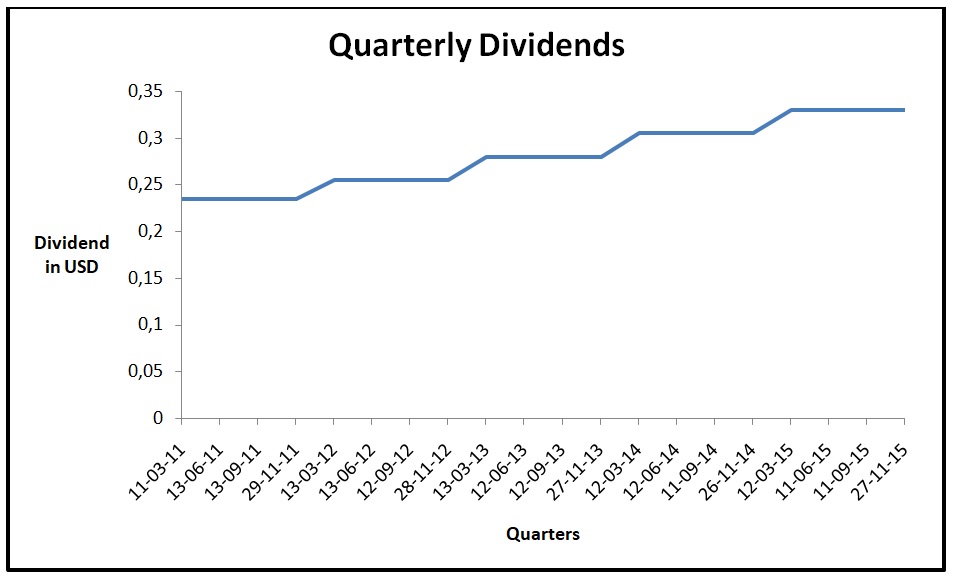
For the five years, the growth rate for revenues was recorded at 9.4% with the net income increasing by 11.5%. The earnings per share increased by 9.4% while the revenue per share increased by 10.5%. Interestingly, despite the dynamics in the global market, the growth rates for the four variables were more than 8%. The growth in revenue per share and earnings per share growth within the last five years were evenly distributed. The table presented below gives information on the quarterly dividends paid by the company for the past five years.
The graph presented below shows the trend of quarterly dividends for the past five years.

Coca-Cola Company’s Dividend Policy
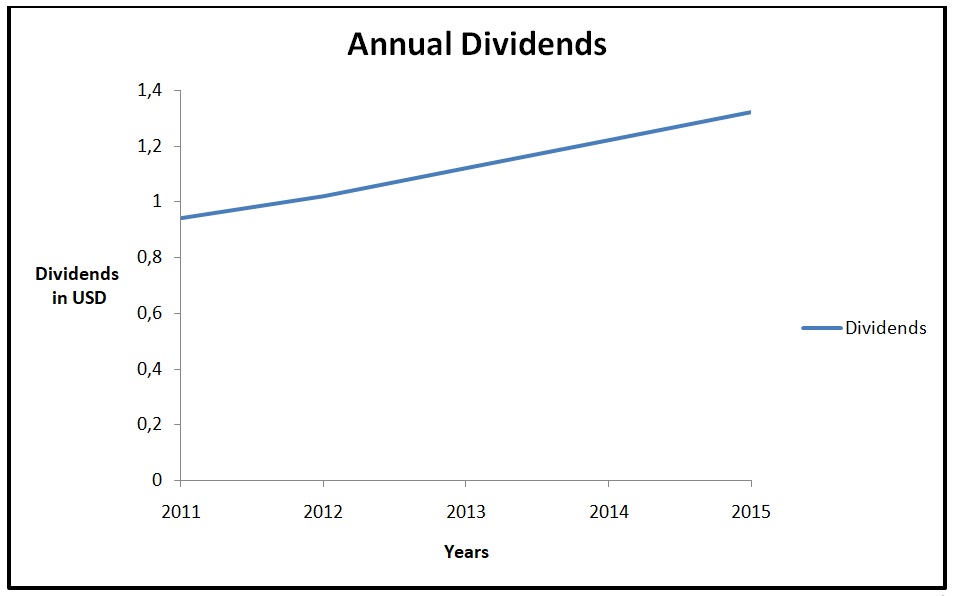
Coca-Cola Company pays dividends to shareholders to keep them upbeat about the returns on their investments. Besides, paying the dividend is a sign of profitability in the company. According to Bierman (2009) “a dividend is the distribution or sharing of parts of profits to a company’s shareholders” (p. 34). Concerning Coca-Cola Company, the dividend policy is designed to balance the future growths and current dividends as a strategy for maximizing the company’s stock price (Siddiqui 2005). For the last five years, Coca-Cola has been consistent in paying the dividend every quarter with a yield of between 2.6% and 2.8% as of the end of the second quarter of the year 2015. Across the five years, the company has been consistent with the increasing dividend policy from $0.23 in the first quarter of the year 2011 to $0.33 in the second quarter of the year 2015. In the four quarters of the year 2011, the dividend per share was $0.23 followed by $0.26 in 2012 and $0.28 in the year 2013. The dividend per share increased to $0.30 in the year 2014 and $0.33 in the year 2015. The increasing trend has lasted for over 25 years. The growth in dividends over the last five years are evenly distributed. The table presented below shows the annual dividend paid by the company between the years 2011 and 2015.
The graph presented below shows the trend of the annual dividend.

From the above chart, it is apparent that the company has experienced an increasing growth in dividends at a consistent rate of between 7% and 10%. Specifically, the annual growth in dividend rates was 9.8% in the year 2012, 8.4% in the year 2013, 8.1% in the year 2014, and 9.8% in the year 2015. The table presented below shows the earnings per share of the company for the past five years.
Sustainability of the Increasing Dividend Policy
From the dividend growth trend, the earnings of the share have also grown by a similar margin over the last five years. This is a good indicator that Coca-Cola’s increasing dividend policy is sustainable (Black 2005). Basically, “dividend growth fuelled by growth in earnings per share is ideal when looking at its sustainability” (Brealey, Stewart, & Franklin 2006). Specifically, the average annual earnings per share growth rate for the last five years is 9.4% while the average annual dividend growth rate for the same period is 9.8%. As a result of equal growth in earnings per share and dividend, it is sensible to conclude that Coca-Cola’s payout ratio responded positively and stayed within the same growth area (Tuller 2007; Watson & Head 2010). Apparently, as a management policy, the company has been proactive in targeting a high payout ratio of between 50% and 60% as a strategy for guaranteeing a sustainable future growth rate of the dividend (Brigham & Ehrhardt C 2005).
Estimating the Future Growth of Dividend
The earning per share estimation for the year 2016 is $2.09 considering the previous trend from the year 2011. This is equal to a growth rate of 5.55% in earnings per share for the next half a decade period. When these figures are applied with the underlying assumption that the payout ratio is between 50% and 60%, the resulting dividend growth rate would likely range from 4.1% up to almost 8.0% for the foreseeable future, if all other factors are held constant. This estimation is summarized below.
End of 2016 earnings per share estimate = $2.09
Half a decade estimated annual earnings per share growth = 5.55%
Estimated earnings per share in the next five years will be $2.74.
From the above estimation, it is to state that the dividend will grow at a relatively higher rate in the foreseeable future since the past dividend performance history and present rate have assumed an upward trend (Shim & Siegel 2009). The history and estimated future growth rate is around 8% and 10%, which is a clear indication of the sustainability of the current increasing dividend policy. In the last five years, the slowest growth rate in dividend was recorded in the year 2014 at 8.1% with the highest growth rate being in the year 9.8% in the year 2012 and 2015. There was no year when the growth rate was below 7%, which is an indication that any downward trend would not create a big margin in dividend growth in the worst-case scenario (Brigham & Houston 2008).
Competitive Advantage and Return on Equity (ROE)
Despite the slight decrease in the ROE for Coca-Cola in the last three years within the five years, its overall performance is still attractive. For instance, the company has managed to maintain its REO above the 20% mark despite the constant increase in dividends over the last five years. This is a clear indication that Coca-Cola has a steady competitive advantage (Deegan 2009). The performance of REO of the last five years is evenly distributed. The table below shows the three ratios that give information on the profitability level for the past five years.
The information in the table above shows that there was a general decline in the net profit margin of the company. A similar trend was observed in the case of return on assets. The drop in the value of these ratios can be attributed to the decrease in sales revenue. It is worth mentioning that over the past few years the company has faced stiff competition from other renowned brands in the market. Also, the negative publicity on the effects of soft drinks has affected the sales volume. The drop in the profitability ratios can also be an indication of low efficiency in the company. This harms shareholder wealth.
Debt and equity
The information in the table below gives information about the capital structure and the number of shares of Coca-Cola Company for the past five years.
The number of shares outstanding dropped from 4,666 million in 2010 to 4,450 in 2014. This can be attributed to the share repurchase program that the company implemented. The reduction in the number of shares explains why the earnings per share rose during the period, despite a drop in the profit level. The amount of debt in the capital structure rose from $23,417 million in 2010 to $41,745 million in 2014. The total stockholder’s equity rose from $31,003 million in 2010 to $33,173 million in 2014. The value dropped to $30,320 in 2014. The leverage level of the company is directly related to the profitability of the company. This in turn affects the amount of profit that is attributed to the shareholders and the shareholder wealth. In the table above, it can be observed that there was a general upward trend in the debt to equity ratio. The value rose from 0.45 in 2010 to 0.63 in 2014. Further, the average financial leverage ratio increased from 2.35 in 2010 to 3.04 in 2014. The increase in the measures of leverage can be attributed to the increase in the amount of the total debt as presented above. An increase in debt increases the amount of interest expense. This in turn lowers the amount of profit that is attributed to the shareholders. The overall impact of an increase in debt is a reduction in shareholders’ wealth.
Relation to the shareholder wealth maximization
Despite the high trend in the year 2011, Coca-Cola’s REO has dropped by almost 3 points. However, the current low REO is still above the industry average which is 18.5%. Even though the present REO of Coca-Cola is below that of PepsiCo, its primary competitor, Coca-Cola still has a stable competitive advantage due to its giant global distribution network and diversification of different product and production lines. Coca-Cola may be classified as “a wide moat stock” (Ehrhardt & Houston 2009, p. 45) due to its global coverage and consistency in growth.
As indicated on the company website, Coca-Cola has a very high credit rating, which is the best in the industry at AA-. This is a clear indication that the current and future dividend growth will be positively skewed to be the advantage of the shareholders (Gitman 2008; Helfert 2010). This means that the shareholders are geared towards receiving high returns on investment in the form of increased dividend per share in the foreseeable future (Kapil 2010).
In the last five years, share outstanding at Coca-Cola declined significantly. Interestingly, Coca-Cola has been proactive in decreasing the shares outstanding and still able to increase the dividend per share at a relatively good rate. This is an indication that the future is bright for the company for shareholders (Kemp & Dunbar 2003). Besides, the management goal has been to sustain the growth through managing the return on equity ratio to ensure that the shareholders not only gain from increased profits but also get the benefit of predictable returns on investment. Therefore, product diversification and an expansive global network are likely to sustain and improve the current dividend per share received by the shareholders as part of the wealth maximization matrix.
Conclusion
The performance of dividend per share received by the shareholders is outstanding at Coca-Cola. As part of the increasing dividend policy, the company has been able to increase its earnings per share for the last five years, which are paid every quarter. The company has a very strong fundamental in the growth of dividend for the period under study and beyond. With an estimated annual dividend growth rate of between 8% and 10% for the entire period, it is apparent that the management goal of shareholder wealth maximization is sustainable in the foreseeable future since it is projected that investors will receive higher returns on their investment in the company (Melicher & Norton 2010). Besides, the long history spanning to more than 50 years of the continuous increase in dividend earnings per share at the company is a clear indicator of the strong competitive advantage as a result of diverse global distribution network, product diversification, and inventory management to control the runaway debt that might eat into the earnings of the shareholders (Lucas 2009; Madura & Gitman 2006). The management goal at the company of investor wealth optimization has been ideal in sustaining high profitability, which translates into more earning per share in the form of dividends payable to the shareholders (Megginson & Smart 2008).
Reference List
Atrill, P & McLaney, E 2008, Accounting and finance for non-specialists, FT Prentice Hall, London.
Bierman, H 2009, An introduction to accounting and managerial finance, World Scientific, Boston.
Black, G 2005, Introduction to accounting and finance, Financial Times Prentice Hall, New Jersey.
Brealey, R, Stewart, M & Franklin, A, 2006, Corporate finance, McGraw-Hill/Irwin, New York.
Brigham, E & Ehrhardt C 2005, Financial management theory and practice, Prentice Hall of India Pvt. Ltd, New Delhi.
Brigham, E & Houston, J 2008, Fundamentals of financial management, Cengage Learning, Hampshire.
Deegan, C 2009, Financial accounting theory, McGraw-Hill, United Kingdom.
Ehrhardt, B & Houston, J 2009, Fundamentals of financial management, South-Western Cengage Learning, USA
Gitman, L 2008, Principles of managerial finance: brief, Addison Wesley Publishers, Boston.
Helfert, E 2010, Financial analysis: tools and techniques: a guide for managers, McGraw-Hill Professional, New York.
Kapil, S 2010, Financial management, Person Education, New Delhi.
Kemp, S & Dunbar, E 2003, Budgeting for managers, McGraw-Hill, New York.
Lucas, W 2009, Principles of finance management, Lucas Wiedemann, New York.
Madura, J & Gitman, L 2006, Introduction to finance, Addison Wesley Publishers, Boston.
Megginson, W & Smart, S 2008, Introduction to corporate finance, Cengage Learning, Hampshire.
Melicher, R & Norton, E 2010, Introduction to finance: markets, investments and financial management, John Wiley and Sons, New York.
Shim, J & Siegel, J 2009, Schaum’s outline of theory and problems of financial accounting, McGraw-Hill Professional, New York.
Siddiqui, 2005, Managerial economics and financial analysis, New Age International (P) Limited, New Delhi.
Tuller, L 2007, Finance for non-finance managers and small business owners, Adams Media, Ohio.
Watson, D & Head, 2010, Corporate Finance: Principle and Practice, Financial Times Management, USA.