Introduction
Economics is the study of a finite world where there are unlimited wants, relative scarcity, and where choices have to be made. In specific terms, it is the study of how individuals and societies choose to employ scarce resources that could have alternative uses to produce products and services now or in the future among various groups in the society. (Glanville and Mark, 64)
In a finite world, individuals and societies are confronted by limited resources such as factors of production, time, budgets, technology, information, and knowledge. The resources are labor, land and capital, and entrepreneurship ability. The alternative resources are matter, technology, time, and energy. The scarcity of the resources that arise in an economic system forces people to make choices. These choices in a finite word have ‘opportunity cost’-this is the value of the next best alternative sacrificed. (Glanville and Mark, 67)
Economics is the social aspect that can be used to study human behavior and institutional arrangements in societies that influence the processes by which the relatively scarce resources are allocated to alternative sources. Economists view things in a unique way. The same people will deliver and apply the principles about economic behavior at two levels i.e. macroeconomics and microeconomics. The microeconomics which forms the basis of this discussion looks at the specific economic unit. All the details of the economic unit are converged in microeconomics analysis or the very small segment of the economy.
Firms, households, and industries are analyzed individually. Economists tend to solve the dilemma of the big question of how the society can be organized in a way that the liberty and autonomy of an individual can be protected yet at the same time provide for the commonweal. The above statement forms the basis of our study in which we shall examine the main concepts of economics related to income and wealth inequality and methods to measure such. In this study, we shall use the Lorenz curve and the Gini Coefficient, which originated in the early years of the twentieth century (1995) by Max Otto Lorenz. (Glanville, 22)
Inequality Analysis
In economics, the inequality analysis is supported in terms of the apparent important groupings in the population. This method chooses a particular defining characteristic that should be a determinant of inequality in some sense and partitions the population into groups according to the value of this population. E.g. sex as a characteristic can form a partition group of men and women. (Champernowne and Cowell 119)
The Lorenz curve
When constructing this curve for measuring worldwide inequality, the standard framework is built up in four stages. This curve also requires one to draw the X and Y-axis in which the X-axis represents the cumulative percent of the household measured and the Y-axis measure the cumulative percentage of wealth. The graph’s axis is closed to form a box. The second procedure requires one to order the distribution from the smallest to the largest.
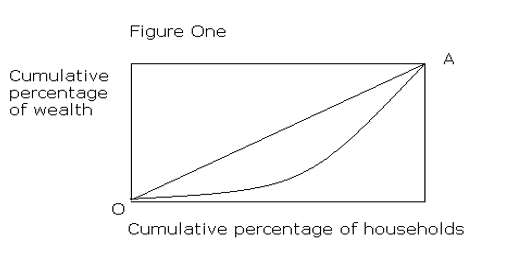
This enables one to answer the questions such as, what proportion of wealth is owned by 10%, 20%, or 30% of the population. This process continues until it is certified that 100% of the population owns 100% of the wealth. In the final analysis, it is assumed that individuals live in a truly equitable society. The relation would then be such that a 10% increase in wealth would result due to a 10% increase in the number of households and that the curve would be a straight curve of 45 degrees. This is called the absolute curve. In the Lorenzo curve, a line based on the data available to an economist is inserted just below the curve and it bows away from the absolute curve. The more unequal a society is further it will diverge from the line of absolute inequality. This can be illustrated in the figure below.

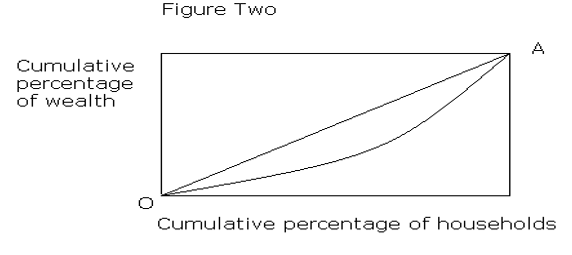
From the figure above we can conclude that the poorest sections of the society command a very low proportion of the countries wealth. That means the majority of individuals are poor and own nothing compared to the rich who owns the most. The line of absolute inequality is represented as OA. The report from the World Institute of Development Economics and Research can be well explained by the use of this graph developed by Lorenzo. The study shows that 2% of the world owns more than half of all the household wealth and that the poorer half of the world’s population owns barely 1% of the global wealth. By drawing Lorenzo’s curve out of this data we can expect a large deviation from the absolute line. (Business hackers) Another different scenario is represented in figure 2 below.

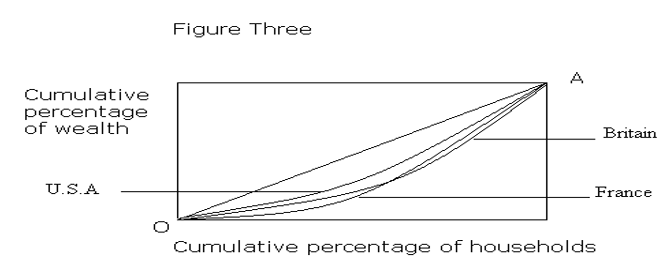
The figures above represent the well-being of poor people. They are much better than in the first scenario though the rich still owns the largest. Society’s wealth is still unevenly distributed. Lorenzo’s curve has the following advantage of providing a visual representation of the information economists may wish to consider and in our case wealth inequality prevailing in the society. The study can also be used to show changes in the way in which wealth has been distributed across different counties. e.g.

The curve does not however show the degree of poverty posed by the poor people; though in most cases the poor can afford some of the luxuries products and services such as television.
The Gini Coefficient
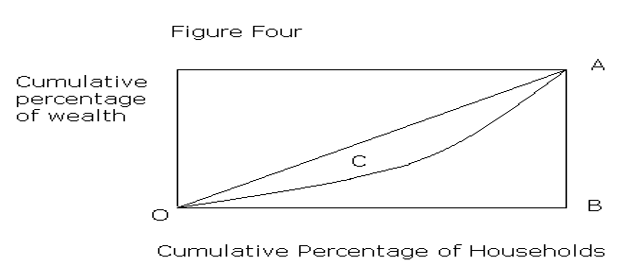
It is a complementary way of representing inequality information. It is termed as the ratio between the Lorenzo curve and the line of absolute equality (numerator) and the whole area under the line of absolute equality. (Denominator). Having extreme values of 0 and 1 the Gini Coefficient can be represented as C/OAB.

The coefficient 0 and 1 are represented as percentages 0% and 100%. The 0% shows that there is equality in terms of wealth while the 100% shows that total inequality of wealth distribution exists. The ratio thus gives an impression that the lower the value between 0 and 100 the higher the probability of equality. The Gini Coefficient, therefore, displays a summary statistic. The coefficient can be represented as a time series trend or as a set of cross-sectional figures.
Meaning
From the preliminary above we can conclude that some countries seem to have more wealth than others. To understand the kind of data presented above it is important to have a clear logic on which to build comparisons of the inequality of distribution wealth. Microeconomics calls for a clear definition of the basic units in society explaining who is to count and also of the characteristic (wealth) whose distribution is to be described.
The explanation below for the existence of such huge decisions in wealth can be of various ways. Most of this is as a result of social change or directly economic in origin.
Different changes in the tax and benefit system
The different tax changes either directly or indirectly have contributed to the increase in relative poverty. Taxes on salary greatly affect the citizens of those countries where the percentage is much higher than where it is low. The benefits system for the disadvantaged in society has also contributed to this inequality.
Unequal distribution of resources
The failure of certain countries to make sure resources are distributed freely is another problem that puts this deviation higher in those countries. It is the work of the government to ensure that, each individual benefits from these resources and that not some few people own them.
Un employment effects
This causes poverty and an increase in income and wealth inequality.e.g. in a case where there is an increase in the No of households but is in paid employment or where a family depends only on the state welfare benefits.
The deviation because of different pays in different jobs and industries
This disparity arises as a result of some companies both in the public and private sector paying wages and salaries that differ. The lowly paid individuals being the less-skilled workers form the highest percentage of households.
Conclusion
It is apparent from our discussion that, inequality of wealth distribution in the world is a common history despite the increasing living standards in the society. Wealth distribution is partly blamed on the government which should ensure that there is equitable distribution. The governments should then be informed about the right process to take to solve this crisis. The terms wealth and income have emerged to be two different words and should not be used interchangeably. Wealth refers to a stock of financial and real assets which includes equities, property, savings in banks, and ownership of land, bonds, etc.
Income on the other hand refers to the flow of factor incomes and they include salary, wages, rent from ownership of land, and interest from banks or dividends from shares. The distribution of the wealth stock is much more unequal than the flow of income in a given fiscal year. People might have an improved wealth-income which improves their standards of living but with less wealth.
References
‘Businesshackers, Web 2.0 startups. Profitable ideas for business. Web 2.0 and life”, 1 million readers can’t be wrong, 2008. Web.
Champernowne, D G. and Cowell, Frank Alan. Economic Inequality and Income, Cambridge University, 1998.
Glanville, Alan and Mark, Stump. Economics from a Global Perspective, Oxford, 1997.
McConnell, Campbell R, and Brue Brue, Stanley L. Microeconomics: Principles, Problems, and Policies, McGraw-Hill Professional, 2005.