Introduction
For my assignment, I have chosen the Mass Transit Railway (MTR), a Hong Kong-based company. Out of the various ongoing projects, I plan to do the Project Management Report on the West Island Line (WIL) project. The length of the railway is estimated to be about 4 miles. The goal of the MTR West Island line is to provide a fast, efficient, and reliable commuter service to residents of the Western District of Hong Kong Island.
The time scheduled for the completion of the WIL project is just under five years, from July 2009, which marks the beginning of construction until the end of 2015, when the project is to be completed in its entirety. The projects are also limited by costs, as resources are limited, which restricts each project to a limited budget. The cost of the entire WIL Project is estimated to be HK$ 15.4 billion, and by the date of its completion, it is estimated that it will have employed 6,600 people.
Project Scope Statement
In terms of meeting the project’s performance/quality specifications, it was anticipated that the West Island Line would be capable of transporting 85,000 passengers per hour per direction. As the West Island, Line would be an extension of the MTR Island Line, and as Mass Transit Railway (MTR) would operate it, the performance/quality aspects of the project were also considered viable from the start.
Project Implementation Control
The project manager at WIL controls and coordinates the project through the managerial actions of planning, organizing, and leading, among others. Project managers’ actions are constantly aimed at change, while other managers’ jobs involve maintaining a stable working environment.
Thus, the WIL project manager has to be a team manager, by interacting with project members, from the General Manager, Construction Managers, and Engineers to the builders, drillers, and technicians at the site. As the WIL project involves international expertise, the project manager has to build team ethos in a multicultural and multilingual group of project staff. Earning the respect of the team is crucial for the project manager.
Therefore, he/she must be a person of utmost honesty, integrity, and vision. The project manager shall control the project constraints to ensure that everything goes as planned. These constraints include time, quality, cost, and scope. The manager will do this by checking project specifications, schedules, and budget allocations. The project manager will use the tools outlined below for that purpose.
Control Point Identification Chart
The chart below will be useful for tracking areas that may go wrong and anticipating ways in which the project manager will solve the problems to avoid nasty surprises. Table 1 shows some of the problems that may occur during the WIL project, how to identify the problem, and the possible solutions.
Table 1 Control Point Identification Chart
Milestone Charts
This powerful implementation tool clearly summarizes the status of a project by highlighting key events. Milestone charts state what events in the project’s life have been completed. In addition, the chart states the duration it took to complete the events, and, whether this is the duration, the project manager had scheduled for the event.
Hence, the manager continually records the variance between the actual and scheduled times. In addition, it outlines the remaining events and the project manager’s anticipated completion time. Table 2 below shows the Milestone chart for the WIL Project. The project is in its fourth year, and as the table indicates, the actual completion times for the remaining “milestones” have not yet been determined.
Table 2: Milestone Chart
Work Breakdown Structure
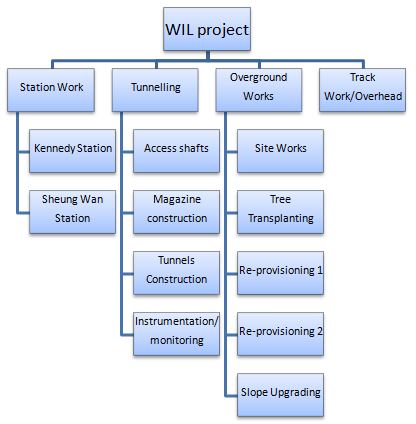
The project manager will subdivide the project scope into manageable segments, assign them to the respective individuals, and document that information. The project manager shall specify the specific requirements of each subunit. This includes approximate budgetary allocation, performance standards, and durations. The project manager will aggregate this information into a clear format for ease of reference. Figure 1 below is a representation of WIL’s Work Breakdown Structure.

Project Network
Project scheduling, estimating, and cost controls are the main factors of a project management system. For companies engaged in future construction, the right forecast of the future project cost is very significant. The WIL Project Plan, mentioned above, is the basis of the project schedule and cost control in WIL. Once the prospective subcontractors have been informed of the deadline for completion of their subcontracts, they submit their bids.
Those, which fit within the WIL project plan parameters of time cost and quality, are selected and given permission to proceed. The process is carried out at the specification phase. However, this is an ongoing process, as a subcontractor may go over budget. This is the responsibility of the particular subcontractor involved, who will cover all extra costs.
Scheduling requires consistent communication between the project manager and project stakeholders, as they will need to be informed of scheduling changes or delays in implementation. It is due to the tentative nature of scheduling that cost control is also a dynamic process. The initial schedule and cost estimates need to be revised in the light of new information acquired during the project lifespan. This means that scheduling and cost control will fluctuate during the project, as the project manager adjusts to changing circumstances.
Network Diagrams
There are two types of network diagrams. These are very useful tools in project control. There are two types of network diagrams: Project Evaluation and Review Technique (PERT) and Critical Path Analysis (CPM). They are complex decision-making tools that enable project managers to organize work and plan workflows. They provide necessary information that is vital in scheduling and budgeting. This information includes the earliest start times of a project, the latest completion times, time floats, and the critical path.
The critical path is the longest route in a network diagram that indicates the time the project will take. It is hard to construct a network diagram for a project with complex times and huge budgets, but the availability of software for that purpose makes it easy. In this project, the techniques may be useful to the project manager in evaluating the progress of the project.
Use of a Gantt chart
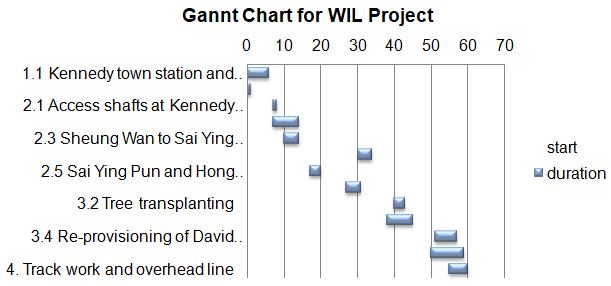
This project’s project manager may find it quite useful to engage the use of a Gantt chart in managing complexity in cost and time. A Gantt chart is an intricate tool used for the management of interrelated tasks with different durations. When using a Gantt chart, the project manager assumes that the tasks are linear, and their durations can be determined beforehand with a high degree of precision. However, it is advisable for management to have duration estimates with the relevant possible contingencies.
A Gantt chart has a number of benefits to the project manager. First, diagrammatically represents the whole project. This makes it easy for the project manager to identify the activities to complete first and clearly, shows the relationships between tasks. Second, it shows the duration of a project.
However, in as much as it may show the tasks clearly, it does not indicate dependencies among tasks, and the project manager may not know from the Gantt chart how the delay of one task may affect another. For this purpose, the project manager will have to use the network diagrams (Chase & Jacobs 200). Figure 2 below shows the Gantt Chart for the WIL project. It indicates the start times and durations for each activity. However, it does indicate the costs. The durations are indicated in months.
Table 4: Activity Durations for Gannt Chart


Legend
- Station Work
- Kennedy town station and overrun tunnel construction
- Modification of Sheung Wan Station
- Tunneling
- Access shafts at Kennedy town Praya and Hill road
- Temporary underground magazine construction
- Sheung Wan to Sai Ying Pun Tunnel Construction
- Instrumentation and monitoring
- Sai Ying Pun and Hong Kong University Station, and Sai Ying Pun to Kennedy Town Tunnel Construction
- Overground Works
- Project site office and works area
- Tree transplanting
- Re-provisioning of Kennedy town swimming pool (phase 1)
- Re-provisioning of David Trench Rehabilitation Centre
- Slope upgrading and natural terrain mitigation works
- Track work and overhead line
Project Time and Cost
Measuring performance is used to determine the success or failure of a project. The project is successful if it has been completed according to specifications and on time. However, for a long-term project such as WIL, these criteria cannot be used to assess the entire project while it is still ongoing. However, they can be used to measure the performance of project tasks, which are an indicator of the eventual outcome of the project (Larson & Gray 198).
As the project parameters are time, cost, and performance, the first measurement parameter for WIL is whether the subcontracts have been completed on time and within budget. In terms of performance, some aspects of the project can only be assessed when it is complete. Nevertheless, if quality control is done for each segment of the project as and when it is completed, the likelihood of the completed project meeting and /or exceeding performance requirements will be increased (Barrat 56).
Earned value analysis
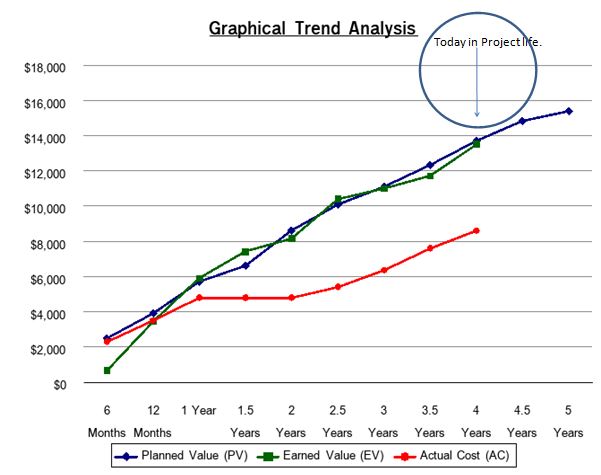
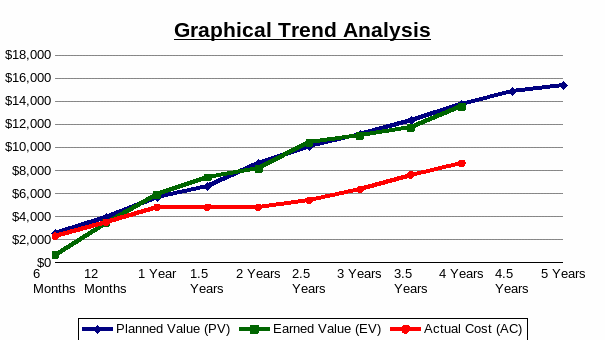
The project, as of now, is in its fourth year. The Estimated Actual cost (8600M) is less than the budgeted cost (13500M) by 5100M. However, the project records a 94% cost success rate. The schedule of the project remains on course as the project is completed within five years. As the graphical Trend Analysis indicates, the actual cost is less than the Planned Value at any time.
Hence, the management negotiation with private landowners has significantly reduced costs. It is crucial to note that all costs in millions of HK $. The following table indicates the project performance as of the fourth year (Kloppenborg 67).

The work started in July of 2009. As of July of 2013, 4 years had elapsed, and the earned value was HK $ 13.5 Billion. The actual cost is less than the budget. The project spent much less than planned because the route of the railway track was slightly reduced after Mass Transit Railway negotiated an agreement with some landowners.
The trend is that the project is behind schedule, but the actual cost is significantly less than the budget because tunneling and over groundworks spent significantly less than what was planned because of a shorter railway route.

In WIL, project change is authorized through change orders. The project manager keeps track of them and reports on them to stakeholders at all levels of the project. Changes are often caused by a change in the clients’ requirements, changes in local authority regulations, correcting errors in the specifications, unavailability of specific materials or equipment, and new technology.
Minimizing misunderstanding due to change is the responsibility of the project manager. Requests for change should include the time and cost estimates for making the change, and the period for responding to the change request.
In WIL, the change procedure is the responsibility of the project manager. As far as reasonably possible under the contract agreements, subcontractors are supposed to fulfill the terms and conditions of their contracts. In the event that a subcontractor is unable to do so, they are required to communicate with the project manager, who will then decide what level of change (if any) can be allowed from the original requirements without compromising project schedule, budget or quality (Gray & Larson 89).
Risk Management. Risk Matrix. Project and Budget Control Chart
Project and budget control charts record cost, schedule performances to ascertain actual and planned performances of the project. Normally these are based on the nature of the work breakdown structure. It makes use of the work packages. In this project, this may not be as applicable but may be useful. The project manager will obtain cumulative amounts for the actual and scheduled performances and drawbar graphs for comparison, as shown in Table 3 below.
The above analysis may act as an early indicator as to whether the project manager will meet the parameters of the project. Hence, it may be used as an effective tool to source for additional time or resources from management. If it is a strict-schedule project, this parameter may offer a way for the manager to organize for overtime and to crash the network diagram for a scheduled finish.
Table 3: Project and Budget Control Chart
Conclusions of the Project
The project did not experience notable setbacks. However, areas of weaknesses were identified in the departmental contacts. For example, the project manager and the head Engineer differed about the time when the groundwork should start. The project manager felt the timing of the groundwork was poor because the weather was likely to hamper with the effectiveness of work. This would lead to wastage of resources.
However, the sales manager was of the opinion that it was meant to save the valuable company time since the project was running concurrently with another project. The Engineer also felt that the project manager’s work had ended at the ‘desktop planning’ stage and should now watch as real work was done. Additionally, after the budget exceeded by $1500, the project manager wrote an explanatory proposal to management, and some managers felt he should have anticipated this instead of bringing it up after it had happened.
However, the project manager explained it was because of the early groundwork by the Engineer that has had an adverse effect on the budget. Hence, he was feeling under pressure to launch the home fast. Lastly, sometimes, the construction Engineer would get specific instructions from the customer wrong, and this would result in the destruction of already constructed parts. In the future, it would be imperative to iron out those little setbacks, but they had no major effect on the construction and the eventual launch.
Works Cited
Barrat, Whitehead. Buying for Business: Insight in Purchasing and Supply Management, New York: Wiley, 2004. Print.
Chase, Richard & Richard, Jacobs. Operations Management for Competitive Advantage, New York: McGraw Irwin, 2006. Print.
Gray, Carlos, and Larson, Edwin. Project Management: The Managerial Process, Singapore: McGraw–Hill Education, 2008. Print.
Kloppenborg, Timothy. Contemporary Project Management, New York: Cengage Learning, 2011. Print.
Larson, Erik & Colins, Gray. Project Management: The Managerial Process, New York: McGraw Irwin, 2011. Print.