Introduction
Over the past few decades, sports have undergone a phenomenon of growth (Leeds & Allmen, 2007). The National Basketball Association is considered one of the most popular sporting events in the United States. Fans of sports including basketball may be a changeable group. For each dedicated fan, there are several fair-weather fans on the other hand to make sure that attendance statistics are constantly changing for the individual team as well as leagues. As a matter of fact, there are many factors that may affect game attendance in the NBA (McCann, 2007).
One of the main objectives of the national basketball association teams is to increase the number of tickets sold for the games. In fact, there are many factors that may decrease or increase the number of tickets sold. In this paper we will examine how ticket sales are affected by four major independent factors; the factors are, income per capita, winning percentage, days of precipitation, and the population of the home city.
These factors will be defined as follows, first, income per capita, which is the average amount of salary that an individual person receives each year. Second, winning percentage, which shows every team’s winning percentage in the previous season and their starting performance at the observed seasons. The third factor is days of precipitation, which shows the number of days that drizzle, rain, sleet, snow, and hail have fallen on each individual city for the two seasons we are observing.
Lastly, city population, which shows the inhabitation of each city that has an NBA home team. All, these factors may directly or indirectly increase or decrease ticket sales for each NBA team individually.
In order to examine the number of ticket sales, attendance data can be collected from the NBA database, for 1999-2000 seasons and 2009-2010 seasons. The number of tickets sold can be determined by considering the changes in the independent variable we explained. By considering these factors, we will be able to determine the number of ticket sales for each individual season.
Economic Analysis
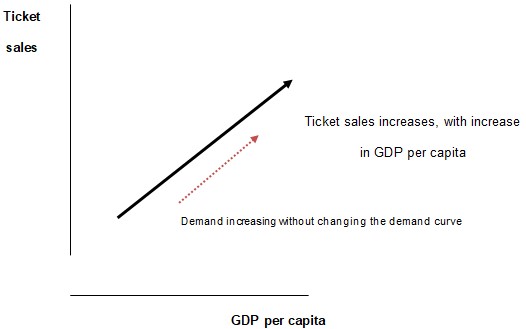
There are several factors that influence the ticket sales and one of the most important factors is the GDP per capita. GDP per capita is the income that an average individual earns and if income of the population increases, the ticket sales are expected to increase because people would have more money to spend and the amount of money spent on luxury items would increase as well.
People tend to spend more money on luxury goods when they have more money in hand after they have consumed or spent money on normal goods. However, if an individual does not have sufficient amount of money to spent then he would not be able to spent money on luxury goods but would be spending most of his money only on goods that are necessary and important for him to live i.e. normal goods. So the relationship between these two factors are positive which means that if the income of an average individual increases then more tickets are expected to be sold more and if the income decreases, then the sale of ticket would reduce because people would spent more money on normal goods that are more important for them to live their lives rather than spending money on luxury items.
Graph 1 below shows the positive relationship between GDP per capita and sales of ticket.

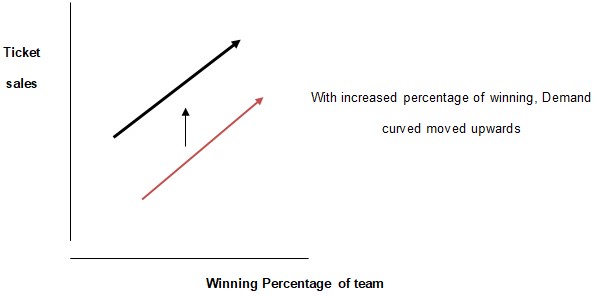
The other factor that has to be analyzed is the winning percentage of the team. As the team starts to win more matches, more people are expected to come and see the match therefore the demand curve would shift upwards considering the same population of the city remains the same, plus ticket price remains the same, and all other factors remaining the same, demand of tickets would increase showing a positive relationship between the two factors.
Graph 2 shows the positive relationship between ticket sales and the winning percentage of the team.

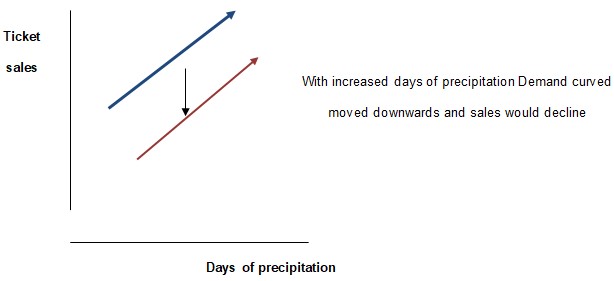
The other factor that is important in analyzing the ticket sales is the days of precipitation. The more days it rains or snow falls or it drizzles, fewer people are expected to come and visit the stadium to watch the match. Because people would face difficulty in coming to stadium and therefore one can expect fewer people coming and watching the match. So a negative relationship can be observed between the number of tickets sold and days of precipitation.
As the number of days of precipitation increases it would hamper the income of the population as well and thus they would have less money to spend on tickets and other luxury items thus the demand curve would shift downwards.
Graph 3 represents the negative relationship between days of precipitation and number of tickets sold.

With increased days of precipitation Demand curved moved downwards and sales would decline.
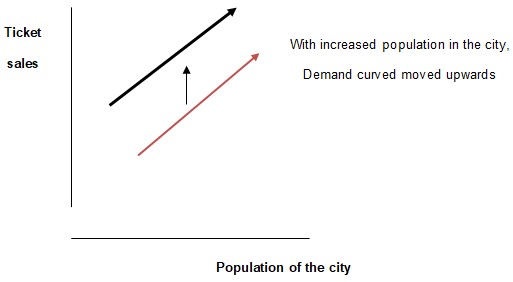
The other factor that is important in determining the ticket sales is the population of the home city. The greater number of people living in the city, there are more chances of people liking the sports and visiting the stadium to watch the match. It is very similar to the supply demand theory in economics i.e. with more people liking the sports, more people would like to come to stadium and watch the match. Therefore the demand of these tickets would increase as the population would increase (Muellbauer, 1975).
There is a positive relationship between these two factors; population in the city and sales of ticket. As the population would increase therefore the demand curve would increase and people would ask for more tickets and thus the sales of tickets would increase (Quah, 1997).

Conclusion
The number of tickets sold of a basketball game is directly dependent on the income per capita. It is known that consumption is a function of the income level of the people. Moreover if the income of people increases they tend to spend more on the luxuries and recreational activities. On the other hand if the income per capita decreases this result in decreasing the consumption or expenditure of the people and people tend to save more. Whenever there is decrease in the income level the budget and expenditure on the luxuries and recreation activities is reduced. Hence there is a direct relationship between the number of tickets sold and the income per capita. Any change in the income per capita will result in a movement on the demand curve changing the sales of the tickets (Francois, 1996).
The number of tickets sold will be also be directly related to the increase in the population. Any increase in the population will result in shifting the demand curve and resulting in more demand of the tickets. The sale of the tickets is also directly related to the winning percentage of the team. The increasing winning percentage will result in increasing the demand curve and hence more sales of the ticket. The last factor which is days of precipitation is indirectly related to the sale of the ticket. This will decrease the demand curve and hence sales will decrease.
References
Francois, J. (1996). Aggregate demand shifts, income distribution, and the Linder hypothesis. The Review of Economics and Statistics, 78(2), 122-134.
Leeds, M. & Allmen, P. (2007). Economics of sports. New York: Addison Wesley.
McCann. “NBA Attendance Figures: Examining Fluctuations in Crowd Numbers 2002 to 2007.” Suite101.com: Online Magazine and Writers’ Network. N.p., n.d. Web.
Muellbauer, J. (1975). Aggregation, income distribution and consumer demand. The Review of Economic Studies, 42(4), 525-543.
Quah, J. (1997). The law of demand when income is price dependent. Econometrica, 65(6), 1421-1442.