Workforce Business Data Analysis Report (Assessment)

Exclusively available on Available only on IvyPanda® Written by Human No AI

Salaries for females and males

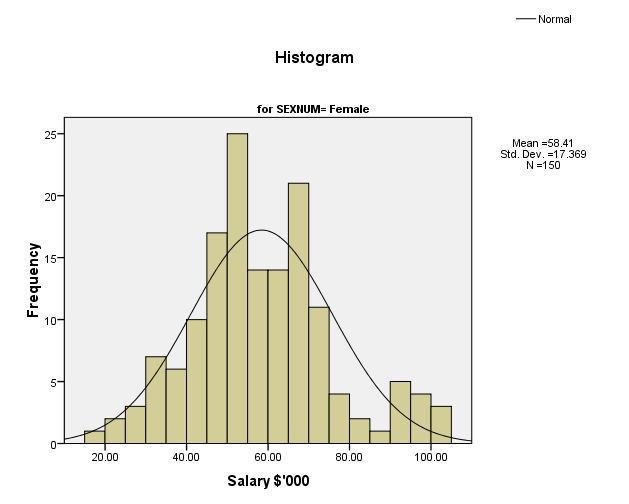
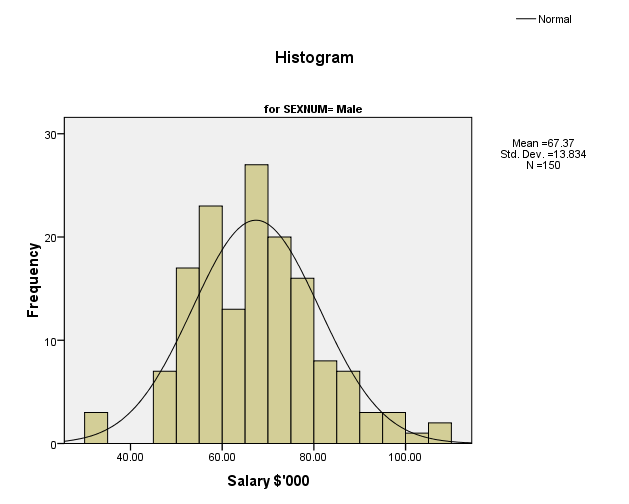
The average salary for Victorian workers, regardless of gender, is $62,890. On average, male workers in the Victorian workforce have a salary of $67,370 whereas the average salary for female workers is slightly lower than that of males as it is $58,410. Male workers are highest paid with the highest salary being $106,200 as compared to $101,260 for the highest-paid female workers. Moreover, the female worker’s group has the least paid workers with the lowest salary being $19,030 compared to the least paid male workers ($31,160).

Table 1: A Summary of Salaries Overall ($’000) in the Victorian Workforce.

Descriptive Statistics
NMinimumMaximumMeanStd. DeviationSkewnessKurtosis
StatisticStatisticStatisticStatisticStatisticStatisticStd. ErrorStatisticStd. Error
Salary $’00030019.03106.2062.890316.30464.165.141.209.281
Valid N (listwise)300

Table 2: Salaries Overall ($’000) for Males and Females in the Victorian Workforce.
Descriptives
Female or Male coded as a numberStatisticStd. Error
Salary $’000MaleMean67.37001.12957
95% Confidence Interval for MeanLower Bound65.1380
Upper Bound69.6020
5% Trimmed Mean67.0510
Median66.8000
Variance191.389
Std. Deviation1.38343E1
Minimum31.16
Maximum106.20
Range75.04
Interquartile Range18.67
Skewness.303.198
Kurtosis.388.394
FemaleMean58.41061.41815
95% Confidence Interval for MeanLower Bound55.6083
Upper Bound61.2129
5% Trimmed Mean57.9755
Median56.2400
Variance301.673
Std. Deviation1.73687E1
Minimum19.03
Maximum101.26
Range82.23
Interquartile Range20.36
Skewness.409.198
Kurtosis.283.394
Distribution of salary ($’000) among male workers.
Figure 1: Distribution of salary ($’000) among male workers.
Distribution of salary ($’000) among female workers.
Figure 2: Distribution of salary ($’000) among female workers.

A summary of the proportion of females and males in each age-group

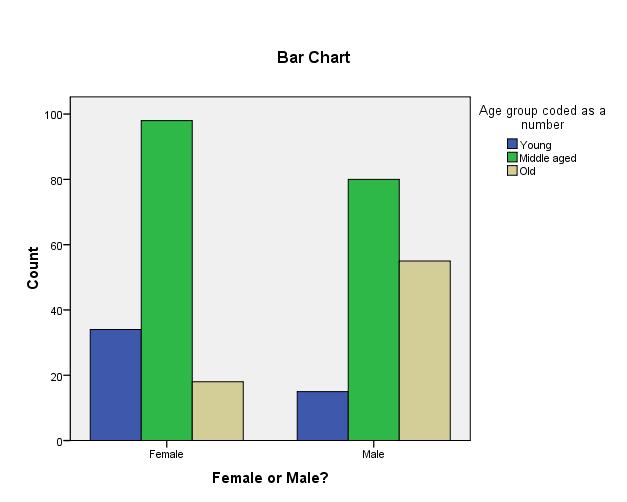
Most of the female workers are middle-aged (98) whereas old female workers are the least (18). Young female workers (34) are almost twice the old female workers. Middle-aged male workers also constitute the largest proportion of male workers (80) whereas young male workers are the least (15) among male workers in Victoria. Old male workers constitute a substantial number (55).

Table 3: A 2×2 Cross Tabulation of the Proportion of Females and Males in each Age-group (Young, Middle Aged and Old).
Female or Male? * Age group coded as a number Crosstabulation
Count
Age group coded as a numberTotal
YoungMiddle agedOld
Female or Male?Female349818150
Male158055150
Total4917873300
A Graphical Representation of female and male workers in each age group
Figure 3: A Graphical Representation of female and male workers in each age group (Young, Middle Aged and Old).

Table 4: A Statistically Significant Chi-Square Statistic for Male and Female Workers in Each Age Group.

Chi-Square Tests
ValuedfAsymp. Sig. (2-sided)
Pearson Chi-Square27.941a2.000
Likelihood Ratio29.0402.000
N of Valid Cases300
a. 0 cells (.0%) have an expected count less than 5. The minimum expected count is 24.50.

It is, therefore, notable that substantial differences exist in terms of gender composition among the different age groups. In particular, there are more female workers among the young and middle age groups whereas old aged male workers are three times the number of females in the same age group.

Industry group representing the largest sample proportion

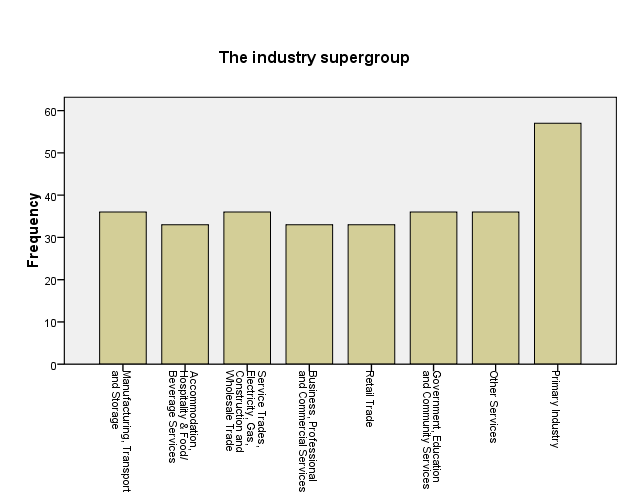
Regarding workforce distribution among various industries, it is evident that the primary industry has the largest proportion of workers (19%). The second-largest proportion of workers (12%) is absorbed in other industries except for the Accommodation, Hospitality & Food/Beverage Services, Retail Trade and Business, Professional and Commercial Services, each absorbing 11% of the workforce.

Table 5: Summaries of the Different Proportions of the Various Industry Groups Represented Victorian Workforce.
The industry supergroup
FrequencyPercentValid PercentCumulative Percent
ValidManufacturing, Transport, and Storage3612.012.012.0
Accommodation, Hospitality & Food/ Beverage Services3311.011.023.0
Service Trades, Electricity, Gas, Construction and Wholesale Trade3612.012.035.0
Business, Professional and Commercial Services3311.011.046.0
Retail Trade3311.011.057.0
Government, Education and Community Services3612.012.069.0
Other Services3612.012.081.0
Primary Industry5719.019.0100.0
Total300100.0100.0
A Graphical Distribution of Victorian Workforce among Various Industries.
Figure 4: A Graphical Distribution of Victorian Workforce among Various Industries.

Table: 6: The Proportion of Male and Female Workers in each Industry Group.

Female or Male coded as a number * The industry supergroup Crosstabulation
Count
The industry supergroupTotal
Manufacturing, Transport, and StorageAccommodation, Hospitality & Food/ Beverage ServicesService Trades, Electricity, Gas, Construction and Wholesale TradeBusiness, Professional and Commercial ServicesRetail TradeGovernment, Education and Community ServicesOther ServicesPrimary Industry
Female or Male coded as a numberMale1815181518181830150
Female1818181815181827150
Total3633363333363657300

Table 7: Chi-Square Statistic showing that the Differences in Gender Composition in Industry Groups are not statistically Significant.

Chi-Square Tests
ValuedfAsymp. Sig. (2-sided)
Pearson Chi-Square.976a7.995
Likelihood Ratio.9777.995
N of Valid Cases300
a. 0 cells (.0%) have an expected count less than 5. The minimum expected count is 16.50.

In the Primary Industry, which has the largest proportion of the workforce, there are slightly more male workers (30) than female workers (27). This difference is very small.

What proportion of the workforce do females account for overall, as well as in both city and country locations?

The overall Victorian workforce has an equal proportion of the male and female workforce (males 150, females 150). Differences however emerge when the location of the workforce is put into consideration. In this regard, there are more female workers in the country (99) as compared to those working in the city (51). On the contrary, most of the male workers are located in the city (82) as compared to those in the countryside (68).

Table 8: Proportion of Overall Male and Female Workers in the Victorian Workforce.

Female or Male?
FrequencyPercentValid PercentCumulative Percent
ValidFemale15050.050.050.0
Male15050.050.0100.0
Total300100.0100.0

Table 9: Proportion of Male and Female Workers based on whether they are Located in the City or the Countryside.

Female or Male? * Workplace location coded as a number Crosstabulation
Count
Workplace location coded as a numberTotal
CityCountry
Female or Male?Female5199150
Male8268150
Total133167300

Table 10: A statistically Significant Chi-Square for male and Female Workforce as Located in the City and the Country.

Chi-Square Tests
ValuedfAsymp. Sig. (2-sided)Exact Sig. (2-sided)Exact Sig. (1-sided)
Pearson Chi-Square12.980a1.000
Continuity Correctionb12.1561.000
Likelihood Ratio13.0801.000
Fisher’s Exact Test.000.000
N of Valid Casesb300
a. 0 cells (.0%) have an expected count less than 5. The minimum expected count is 66.50.
b. Computed only for a 2×2 table

Females’ salary and other numerical variables

Having more improvement courses translate to higher salaries among female workers. Female workers who have done three improvement courses have a higher salary on average ($88,910) as compared to those who have done one improvement course ($70,730) or those who have not done any improvement course ($49,690). Female workers who have either two children or none earn almost the same salary on average ($56,910 and 56,950 respectively).

However, the average salary for women with one child is lower ($51,420). The salary scale increases as the number of children a woman has increased, with females with five children earning the most ($82,400). Exceeding five children, however, seem to be related to a decrease in salary ($75,340 from $82,400 for females with five children). Single female workers earn slightly higher ($59,160) than their married counterparts ($57,400).

The higher the number of years women have had in an industry does not necessarily translate to a higher salary. For instance, while female workers with 9 years of experience have an average salary of $94,250, the average salary for those with 33 years of experience is $71,400.

More related papers Related Essay Examples
Cite This paper
You're welcome to use this sample in your assignment. Be sure to cite it correctly

Reference

IvyPanda. (2021, February 16). Workforce Business Data Analysis. https://ivypanda.com/essays/workforce-business-data-analysis/

Work Cited

"Workforce Business Data Analysis." IvyPanda, 16 Feb. 2021, ivypanda.com/essays/workforce-business-data-analysis/.

References

IvyPanda. (2021) 'Workforce Business Data Analysis'. 16 February.

References

IvyPanda. 2021. "Workforce Business Data Analysis." February 16, 2021. https://ivypanda.com/essays/workforce-business-data-analysis/.

1. IvyPanda. "Workforce Business Data Analysis." February 16, 2021. https://ivypanda.com/essays/workforce-business-data-analysis/.


Bibliography


IvyPanda. "Workforce Business Data Analysis." February 16, 2021. https://ivypanda.com/essays/workforce-business-data-analysis/.

If, for any reason, you believe that this content should not be published on our website, please request its removal.
Updated:
This academic paper example has been carefully picked, checked and refined by our editorial team.
No AI was involved: only quilified experts contributed.
You are free to use it for the following purposes:
  • To find inspiration for your paper and overcome writer’s block
  • As a source of information (ensure proper referencing)
  • As a template for you assignment
1 / 1