Introduction
A review of the financial report of 3D systems reveals that its current market is quite unpromising. In 2012, the market worth was $2.2 billion across the world. The value increased by 29% from the previous year.
The massive movement from the production of prototypes to the production of finished goods resulted in the 29% increase.
For instance, in 2012, over 25% of the market produced finished products and not prototypes. Further, there has been continuous improvement in the quality of products in the market of 3D printing (General Electric 2013).
Macro drivers
There exist a number of macro drivers that have contributed to the robust growth of the 3D systems. The first growth driver is that there are new market opportunities across the world. Also, studies show that the products of the company can easily penetrate the market.
The approximated penetration level of additive manufacturing is 8%. This implies that the market that can still be reached is worth about $21.4 billion.
Further, the new market opportunities relate to several industries, such as power and water, aerospace, automotive, consumer, and health care (MIT Technology Review 2013). Thus, the market for 3D systems is quite expansive.
The second driver for growth is research and development. The ability of materials of a 3D printer has a significant impact on the market for the 3D system. A recent research was carried out to find out the growth rate of research and development investment.
In the research, patents were used as a proxy for research and development investment. The research showed that the patents issued and patent applications filed had grown tremendously between the period 2001 and 2012.
Further, the research showed that the investment on research and development concentrated on material because it is the key driver for growth. It is estimated that investment in research and development resulted in an increase in the amount of sales by about 8% in 2012.
The third driver is affordability. A decline in price of AM systems and development of agencies for direct production of parts have made the 3D system affordable. A recent research carried out between 2003 and 2012 shows that there was up to 95% decline in cost.
In addition, there is tremendous increase in the variety of the product. The manufacturers offer different products that have different prices and features. This gives consumers a variety to choose from. The final driver is the support from the government.
For instance, in the United States, the Congress is yet to authorize an investment worth $1 billion in the field of additive manufacturing.
Further, several institutions such as companies, universities, community colleges, and non-profit organizations are also carrying out extensive research on thed 3D systems (Thomson Reuters 2013). This has a positive impact on the growth and development of the product in the market.
Evaluation of the industry
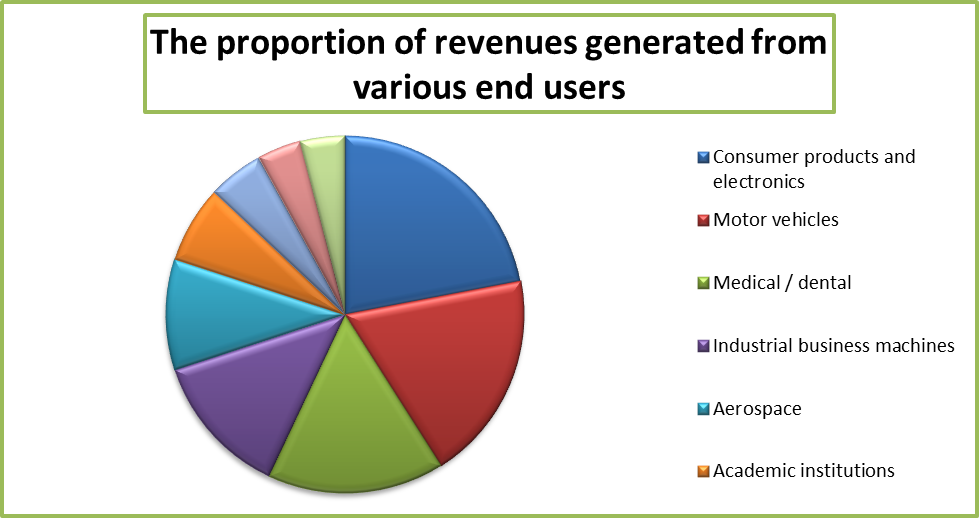
The additive manufacturing industry in the US is made up of three main players, these are DDD, XONE, and SSYS. As mentioned above, the market is worth about $2.2 billion (The Economist Newspaper Limited 2013). The consumers of the products are listed in the table below.
The industry receives the highest amount of revenue from consumer products and electronics and is followed by motor vehicles and medical uses markets. The proportion of revenue can be illustrated in a pie chart as shown below.

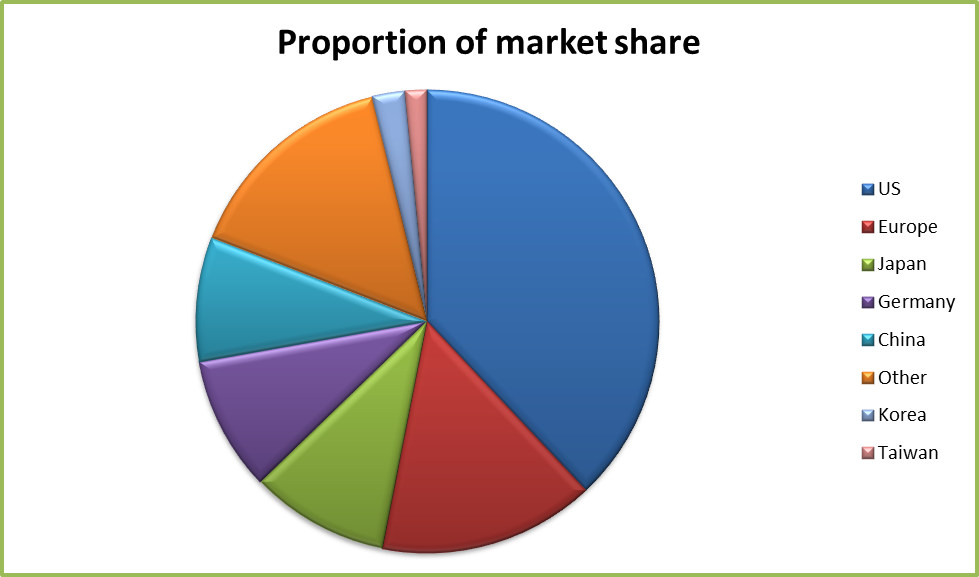
Geographically, the United States is the largest market for 3D systems. It has a share of 38% globally. The table presented below shows the market the share of the 3D installation across the world. The data relate to the period between 1988 and 2012.
The proportion of the market share can be presented in a pie chart as illustrated below.

The US market is the largest followed by European and Japanese ones. However, it is anticipated that the Asian market would grow by a large margin in the near future. The industry practices patent protection of the entire system. This element is important for growth of sales and profit.
Financial data
As mentioned in the section above, the 3D market is made up of three main players, which are DDD, XONE, and SSYS.
The financial information about the 3D systems is also presented separately for each of the three players. However, the financial data analysis will focus on the 3D system. Various aspects of the financial data of the entity will be analyzed. Some of the aspects are discussed below.
Sales and margin analysis
The amount of sales and gross profit margin are expected to grow in the coming years. The expected sales for the year ended 2013 amount to $509.8 million while the gross profit margin equals to $270.7 million. In terms of percentage, the gross profit margin is 53.1%.
The sales revenue grew by 44% in 2011, 53% in 2012 and it is expected to raise further by 46%. Moreover, after 2013, the amount of sales is expected to be less than 30%.
This can be a sign that the growth of sale will stabilize in the market after 2015. The quarterly EBITA margin in 2012 ranged between 21.8% and 24.8% (Collier 2009). In 2013, the margin is expected to range between 22.8% and 31.4%.
Capital allocation
The EBITDA as a percentage of sales increased from 23% in 2011 to 26% in 2012. The ratio is expected to increase further to 29%. Further, the operating cash flow increased from $32 million in 2011 to $48 million in 2012. The value is expected to increase to $79 million in 2013.
It can be observed that the company has a high amount of operating cash flow. This can be attributed to the decline in the amount of gross debt. In the fourth quarter of 2011, the amount of gross debt was $139 million.
The value declined to $32 million in the second quarter of 2013. Further, the value of goodwill as a percentage of total assets increased from 37% in 2008 to 46% in 2012. The growth in the goodwill was a result of a significant increase in the number of mergers and acquisitions.
The company spends a cash balance that is in excess of 20% of sales on merger and acquisition (Atrill 2009). A total number of acquisitions that the company has made since 2009 are 33.
Conclusion
The future of the company looks attractive. However, the company faces competition from its rivals. This can negatively impact on the growth prospects. Also, the company may be challenged with a risk of losing its competitive advantage because of a rapid change in technology.
Many acquisitions may negatively impact on the profitability of the company when they are not properly integrated. The management of the company needs to check the impact of the risk factors on the future performance of the company. This will ensure that the projected results are achieved.
References
Atrill, P 2009, Financial management for decision makers, Financial Times Prentice Hall, New York.
Collier, P 2009, Accounting for managers, John Wiley & Sons Ltd, London.
General Electric 2013, Additive manufacturing is reinventing the way we work. Web.
MIT Technology Review 2013, Additive manufacturing. Web.
The Economist Newspaper Limited 2013, 3D printing scales up. Web.
Thomson Reuters 2013, Global additive manufacturing market. Web.