About Yahoo, Inc.
Yahoo, Inc. is a multinational company that operates in the internet industry. It is a publicly held company that was established in 1994. The headquarters of the company is based in California, USA. The company offer products and services that comprise of communication, search, and content tools.
The products and services are offered in a variety of languages. A significant amount of revenue for the company is generated from advertising. The company also generates revenue from other sources such as royalties among others. The paper seeks to analyze the performance of the company for the between 2010 and 2012.
Analysis of Trend
Income Statement
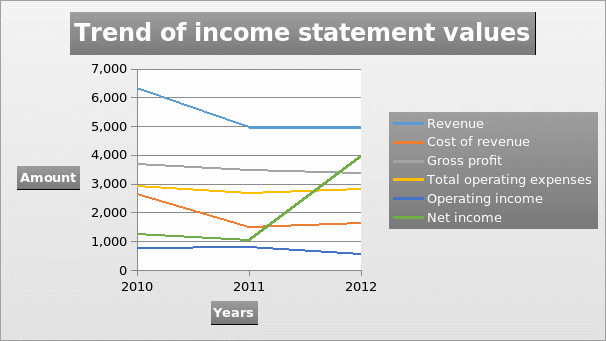
Analysis the trend of various values and ratios of a company gives information on whether the performance of a company is improving or deteriorating. Analysis of income statement of the company shows that the revenue declined from $6,325 million in 2010 to $4,984 million in 2011.
The value slightly improved in 2012 to $4,987 million. This shows a decline in the amount of revenue earned by the company over the period. The cost of revenue also declined from $2,628 million in 2010 to $1,503 million in 2011. In 2012, the cost of sales increased to $1,621 million.
These changes resulted in a decline of gross profit over the three-year period. The value declined from $3,697 million in 2010 to $3,482 million in 2011. The value further declined to $3,366 million in 2012. The operating expenses changed in the same trend as cost of revenue.
The value declined from $2,925 million in 2010 to $2,681 million in 2011. In 2012, the operating expenses increased to $2,800 million. The resulting operating income increased from $773 million in 2010 to $800 million in 2011. However, in 2012 the operating income declined to $566 million.
Analysis of income statement reveals that the company made a number of sales of its investments. For instance, in 2010, the company sold Zimbra, Inc. and HotJob. In 2012, the company sold Alibaba Group Shares at $4,603 million.
These sales boosted the value of net income. Net income declined from $1,232 million in 2010 to $1,049 million in 2011. The value increased to 3,945 million in 2012. The graph presented below shows the trend of the values.

Balance Sheet
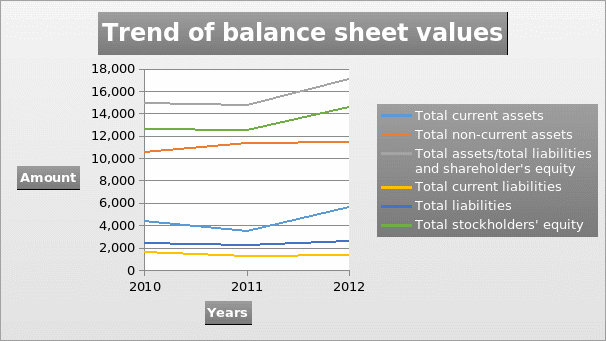
The total current assets declined from $4,346 million in 2010 to $3,453 million in 2011. In 2012, the value increased to $5,653.The increase was attributed to the increase in the amount of total cash. Despite the sale of total investment, the value of non-current assets declined increased from $10,584 in 2010 to $11,330 in 2011.
The value further increased to $11,451 in 2012. The value of current liabilities, total liabilities, and shareholder’s equity declined between 2010 and 2011. The values increased in 2012.
Finally, the value of total assets (total liabilities and stakeholder’s equity) declined from $14,928 million in 2010 to 14,783 million in 2011. In 2012, the value increased to $17,103 million. The graph presented below shows the trend of the values.

Profitability ratios
The profitability ratios are presented in Table 1. Gross profit margin and net margin show that the profitability of the company improved over the period.
Table 1
However, return on assets and return on equity indicate that profitability declined in 2011 and improved in 2013. Finally, asset turnover indicates that the company reported a decline in efficiency over the period.
Conclusion
During the dot-com bubble, a number of companies reported a significant increase in the value of the company. However, after the bubble burst, the companies reported a significant decline in performance and some companies did not survive the burst.
The results above indicate the bubble burst affected the operational performance and efficiency of Yahoo, Inc. However, the company used a number of turnaround strategies such as sale of investments. These strategies resulted in the success of the company after the dot-com bubble burst.