Abstract
The purpose of the present work was to determine the frequency of the sound wave in the state of resonance. To perform the experiment, a piston was placed at a tuning fork, which changed position. The cavity inside the piston was filled with a sound wave reflecting off the wall and leading to resonance at a particular wavelength. As a result of this resonance, the amplitude of the two oscillations increased dramatically, which was expressed as an increase in the loudness of the sound. The paper contains calculations of the two frequencies for the two forks and a comparison of the results obtained with the specifications of the forks themselves.
Data
In this laboratory work, the frequencies at which resonance occurs, that is, the sound of fork vibration is repeatedly amplified, were measured. The frequencies were determined for two piston positions: the position of the piston depending on how many lengths of sound waves would enter the free space of the tube. It is worth keeping in mind that the difference between the piston positions determines half of the wavelength. Table 1 shows the measurement results for these frequencies. At first glance, it is evident that when the half-wavelength was minimum (∆x = 17.5 cm), the sound wave frequency was maximum (f = 1024 Hz). In addition, in order to find the speed of sound propagation in the air, the temperature in the room was measured, which was 21.3 °C.
Table 1: Results of direct frequency measurements
Results
The measured temperature value was used to calculate the speed of the sound wave, viz.:
Based on the calculated data, it becomes possible to determine the frequency of the sound wave for the first fork:
And for the second fork:
- During the experiment, there was no sense that the forks vibrated at more than one frequency. The vibration sound was clear and monotonous.
- If there was a feeling that the forks were vibrating at more than one frequency, in fact, the frequencies would be related. The coupling of frequencies may be due to the fact that sound waves come from the fork and then are reflected from the piston and hit the fork again. In other words, the tuning fork could receive the reflected waves and change its own frequencies, which would be reflected in the multifrequency sound of the fork.
- For the first tuning fork, the calculated frequency was 514 Hz, and the technical frequency indicated on the fork is 512 Hz; the percentage difference in error, in this case, is 0.39%. For the second fork, the calculated frequency was 984 Hz, and the technical frequency was 1024 Hz: the percentage error, in this case, was 4.07%. Thus, in both cases, the error percentage was low.
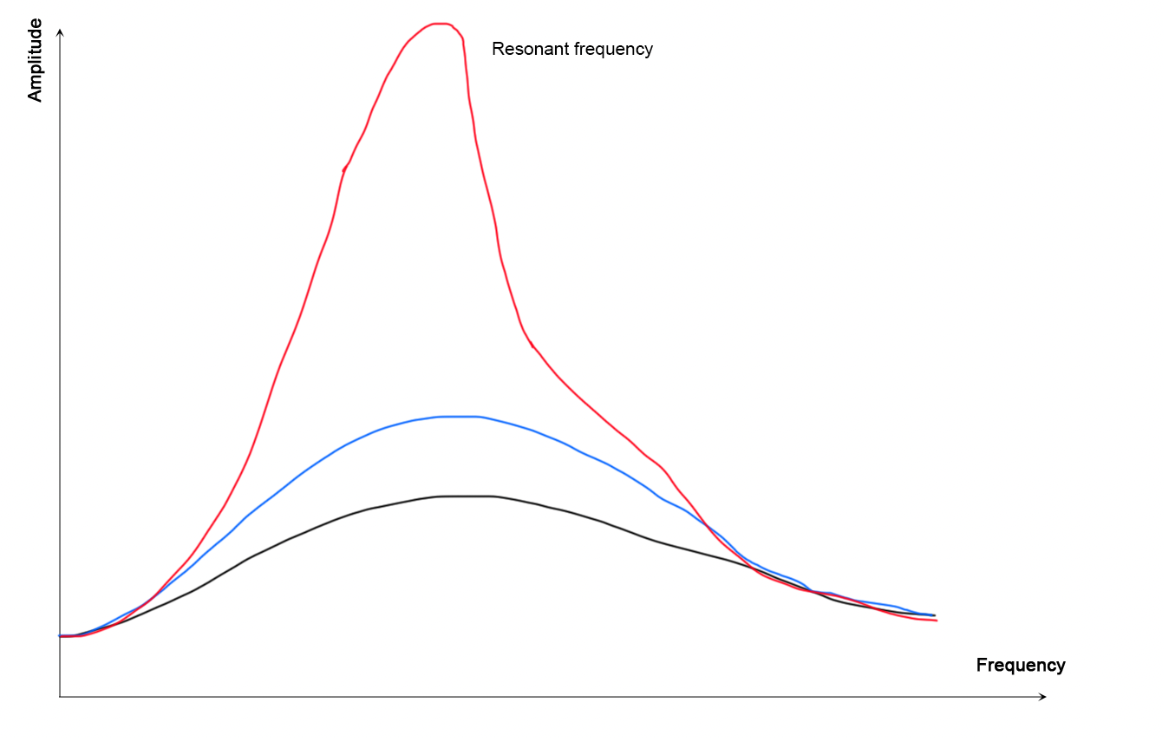
It is also worth noting that the sound from the tuning fork did get louder when the pore was pushed back to a specific length. The reason for the amplification is the phenomenon of resonance, during which the incoming and reflected waves coincide with each other in phase. As the frequencies coincide, the amplitude of the vibrations increases dramatically, and physically it is felt as a louder sound (OpenStax). The diagram below illustrates this process: the two frequencies coincide, and the amplitude increases dramatically

Conclusion
In conclusion, the phenomenon of resonance for sound waves was observed in this work. The location of the piston influenced the achievement of the resonance because it was necessary to achieve a difference ∆x such that half of the wavelength was placed in the piston space. The work showed that in both cases, the percentage error was minimal, indicating the high accuracy and reliability of the results obtained.
Reference
OpenStax. (n.d.). 17.4 normal modes of a standing sound wave. OpenStax. Web.