Introduction
A2B Australia Limited (A2B.AX) is one of Australia’s top taxi companies in the transportation sector. The company was previously known as Cabcharge and was first established in Sydney. It provides payment solutions and transportation services to government, private companies, drivers, and individual customers (Yahoo Finance, 2020). In 1976, the corporation was formally established in the Australian city of Sydney. A2B Australia’s financial statements will be examined in this report, as well as the company’s shareholders’ analysis, risk-return analysis, and cost of capital estimates.
Summary of the Business
A2B Australia is a provider of software and financial solutions by providing personal transportation services. Some of its key businesses include non-cash payment facilities, taxi reservations and dispatch facilities, software and hardware services such as insurance and training (A2B.AX – A2B Australia Ltd Profile, 2020). This business exists primarily to benefit its customers by offering high-quality goods and services. Nonetheless, the company’s subsidiaries have a significant role to play in achieving this aim as well.
Chairman/Director’s Message
The chairman’s message emphasizes on the importance of providing consumers with high-quality products and services, as well as maintaining a long-term connection based on trust and loyalty. The company’s chairman also stated that they will do everything they can to make their product more enticing to customers, no matter how fierce the competition and constraints are (Annual Report, 2021, pg.8). A2B will keep an eye out for ways to improve the value of its investments for the benefit of its shareholders.
According to the firm’s managing director, all of the company’s employees were recognized for their efforts in helping the company achieve a high level of revenue growth (Annual Report, 2021, pg.103). He said that A2B had attracted new clients who were enthusiastic about the company, and that the company’s internal investors will be given first priority going forward. Both the chairman and the managing director have demonstrated a great deal of interest in boosting shareholder value and in the work of their present teams, and they are looking forward to attaining the main aim of providing their customers trust and faith in A2B.
Profile of Investors
Income, safety, and growth are the primary objectives of any investment company (Basic Investment Objectives 2021). Investors must give up some safety in exchange for a higher rate of return, but this comes at the cost of increased risk. The more the risk, the higher the yield will become. Capital gain is realized only when the cost at which it is sold is higher than the buying price, and is primarily for investors who are searching for a longer period of growth rather than a continual eternal investment income.
A2B has a market capitalization value of $ 213,162,309 million (computed in section 4). A2B is a start-up firm serving as a limited market sector, as seen by its low market capitalization value. Long-term investors that can deal with short-term price volatility and take advantage of the significant growth prospects offered by small-cap companies can reap significant rewards. As a result of the Covid-19, it is possible that the company’s stock may be more vulnerable to market volatility and intense competition. As a result, the company’s internal investors are the ones most concerned about it.
Investors may be alarmed concerning the decline in the company’s share price in 2022. In addition, the net cash position for 2012 declined to $ 16.5 million, which is smaller than FY 2021 and this is owing to an increase in total assets of $ 214,900,000 (Annual Report 2021, p.25). There will be a rise in the involvement of institutional investors since they care more about the company’s growth and legitimacy than its financial credibility and success.
Furthermore, A2B has a price-earnings (p/e) ratio of 15.31, which is above the industry average of 11.3 p/e for the transportation sector (Simple Wall St 2020). When a company’s p/e ratio is greater, it gives the competitors an impression that it is in the lead. In such a scenario, even if the current share price of A2B falls but the earnings rise, the p/e ratio will still show a positive trend for the stock. It is possible that this will entice additional investors to acquire the inflated shares now and profit from a rise in the share price later. A2B’s high p/e ratio might entice short-term passive investors to acquire their shares.
Before making any investment selections, investors would consider the Net Profit after Tax (NPAT). The NPAT would be more important to a value investor than the p/e ratio. Investing decisions are made based on the quick ratio, which tells value investors how much debt the firm has thereby enabling them make relevant decisions on their investments. A2B has a quick ratio of 1.57, which is higher than 1, indicating that it is secure, adaptable, and well-positioned to fulfill its future financial commitments (Morningstar, 2020). Because of this, both active and passive investors would be interested to invest in A2B.
A2B has been paying dividends to shareholders for more than a decade, according to the dividend trend. For the past four years, it has maintained a fully franked dividend as a dividend-paying corporation. This demonstrates that the corporation places a high value on the interests of its investors. A2B’s institutional investors will be more inclined to stay with the firm, and new investors will be more inclined to invest in A2B as a result. As a result, rather than focusing on capital growth, A2B is focused on income generation.
Non-Marginal Investors
Table 1.1 below shows the Top 20 shareholders listed in the Annual Report 2021 of A2B Australia Limited.
Table 1.1 shows that Citicorp Nominees Pty Limited (Australia) Limited is the largest stakeholder in A2B, with a stake in the company equal to 40,510,410 shares, the company’s issued capital, and the greatest percentage of issued capital. The majority of A2B’s shareholders are made up of nearly 40% of nominees, and these investors are referred to as institutional investors. Consequently, as long as they possess a significant number of shares and engage in the buying and selling of those shares, they might be considered marginal investors (Farmantra, 2019). The remaining organizations are referred to as on-marginal investors as they own a little amount of A2B shares.
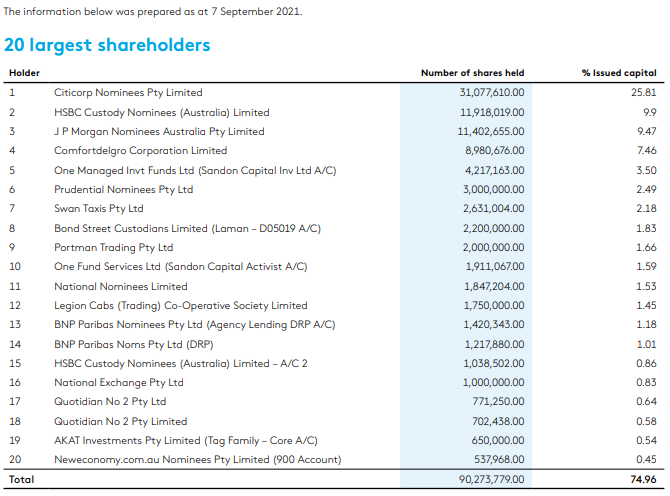
Table 1.2 shows the nominee accounts and banks for the six of the marginal investors. Both Legion Cabs (Trading) Co-Operative Society Limited and Comfortdelgro Corporation Limited are significant cab businesses. They compete with each other for provision of services in the transport sector. There are five nominee accounts with a well-diversified holding. Due to the fact that they are not able to diversify their investments, these investors are particularly sensitive to market risk, which is the only one that cannot be mitigated. With A2B’s many hazards, any investors who lack a well-diversified portfolio are at risk of loosing their shares.
Table 1.2. Marginal Investors and Non-Marginal Investors
A2B has three non-institutional investors with a low percentage of the issued capital. In order to diversify their portfolios, these small investors only own a small number of shares and lack the necessary expertise to do so. Additionally, there are also 21.58% of the non-marginal investors in A2B that are invested internally. It is more reasonable to employ DGM as an appropriate method for calculation since the non-marginal investors of A2B account for 26.53 %, which is more than 1%.
Risk Return Analysis
Review of Listed Risks
Investment risk is the variability in expected return and indicates the level of uncertainty that an investor is willing to accept in order to realize a profit from their investment (The Economic Times, 2020). This discussion will be focused on an examination of A2B’s external risks and how they have affected its gain over time. There are two kinds of risk: systematic and unsystematic. It is possible for a whole market to collapse, yet it is impossible for a single industry to fail unsystematically (Amy Fontinelle, 2019). According to the annual report of A2B FY21, the rules for taxis will be changed. The more regulations and norms there are, the more enterprises are subjected to regulation and control. For example, the “New State Passenger levies” have been introduced, which include a threshold for service charge transactions. It is possible that taxi regulatory authorities might set lower restrictions on the amount of service costs that can be paid by A2B customers, which could have an impact on income (Annual Report, 2019). A2B’s long-term goals may be impacted by this scenario.
In addition, there is a possibility of technological failure which might bring about risks. Given that A2B has already integrated IT into its company, it is critical that A2B maintain its position in the market by complying with network operations, bookings, and payment (Annual Report, 2021). Because of this, A2B must continually spend in R&D in order to stay abreast of emerging technologies and adopt them effectively. There is also a need to deploy well-skilled personnel in the field of IT for proper management of technology.
Finally, A2B may be threatened by interest rate risk. A rise in loans and borrowings may be seen in A2B’s balance sheet (Annual Report, 2021, p.23). If the government intervenes, this can be expensive and may bring about catastrophic outcomes. A2B’s overall revenues would be reduced if the government implemented a new monetary policy that increased the interest rate. This means that the financial institutions will want more from A2B, making its stockholders unhappy.
Evidence of Risk
According to the analysis above, regulatory reforms have received a lot of attention in the recent past. In 2010, lawsuits were filed against A2B Australia for violating rules and regulations. Due to A2B’s unlawful activities, the company was fined $ 15 million in total (Australian Competition Law, 2010). Charges of an extra 10% on credit card payments and anti-competitive acts such as charging less than the cab price were leveled against A2B. A2B has to cooperate with Taxi regulatory organizations to enhance its corporate image following these charges and the high cost of a litigation suit.
Additionally, technology may serve as a barrier for A2B in their quest to outdo their immediate competitors. However, as a result of the recent debut of the e-ticket and fast-card, A2B has an advantage over its primary competitors such as Lindsay Australia LTD (LAU) (Annual Report, 2021, p.17). Innovative thinking in the sector was made possible thanks to the purchase of Mobile Technology International. Even though A2B has a strong position on technology, it needs to keep an eye on what its competitors are doing since technology is always evolving at a quick pace.
Finally, there was a discussion about interest rate risk for A2B company. According to the annual report for 2021, A2B’s total liabilities climbed from $42.5 million in FY20 to $50.8 million in 2021 (Annual report, 2021) an increase of $24 million. This increase in the interest rate risk reflects an increase in loans and borrowings. Increasing interest rates might have an influence on A2B if the government decides to do so as the cost of borrowing may rise tremendously. Even though most economic activities have been paused due to the recent worldwide epidemic, the government’s possible monetary policy efforts are difficult to anticipate, although modifications may be made later on that affect company activities. Since A2B’s initial style of conducting business has been altered to encourage social distance, this might lead to an increase in A2B’s pay, which could put A2B in financial difficulty.
Review of Shareholder Return
The most common formula that is used in the computation of total shareholder returns for the FY2021 is as follows:
Total Shareholder Returns = Dividend Yield + Capital Gain
For A2B company, their share price was $ 1.77 at 30 June 2021 while their closing price was $ 2.40 as of 30 June 2020. With the use of this figures, the capital gain for the company may be calculated as follows:


As stated in its annual report, A2B pays both interim and final dividends. Both of the quarterly and annual dividends were equal to $0.04 (Annual Report, 2019, p.83). In order to arrive at the split yield, the franked divided must be grossed, and these numbers might help. The following is how it is represented mathematically:

The Franking Proportion will account for 100% in case of full ranking in the interim and final dividends.

The formula used to calculate gross dividend is as follows:

Gross dividend (Interim) = $0.0171+ $0.04 = $0.0571
Gross dividend (Final) = $0.0171 + $0.04 = $0.0571
On the other hand, the dividend yield for the A2B company may be expressed mathematically using the formula shown below:

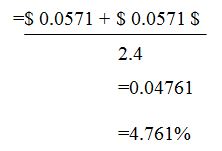
Provided that the value of the capital gain is shown as -26.25% while the dividend is 4.761%, the total shareholder return for the financial year 2021 is given by the following:
Total Shareholder return = 4.761% + -26.51% = -21.49%
Based on shareholder returns and stock returns, the final computation is made. As a sector indicator, we would use the All Ordinaries Index (AORD). The Australian Securities Exchange’s All Ordinaries Index (AORD) is often regarded as a leading indicator of the entire market (Market Index 2020). There is a full breakdown of the overall market return in Appendix A, using the following mathematical formula:

A2B’s total market return for the period 30 June 2020 to 30 June 2021 is 5.97 %, according to the computation in appendix A. Since the market return is 5.97 %, A2B’s overall shareholder return is -21.49 %. It may be stated that A2B significantly under-performed the market in comparison to its competitors.
Review of Capital Projects
As a result of capital investments in FY21, the A2B annual report shows an increasing trend. Gold Coast Cab (GCB) and Mobile Technologies International Pty Ltd (MTI) were bought by A2B in order to broaden its market reach and provide additional payment methods (Annual Report 2021). A2B was able to generate a positive cash flow for FY21 thanks to the initiatives. According to the following table, income increased by 6.7 %, while net profit after tax increased by 9.8 %. This helped the company outperform the market’s expectations for FY21.
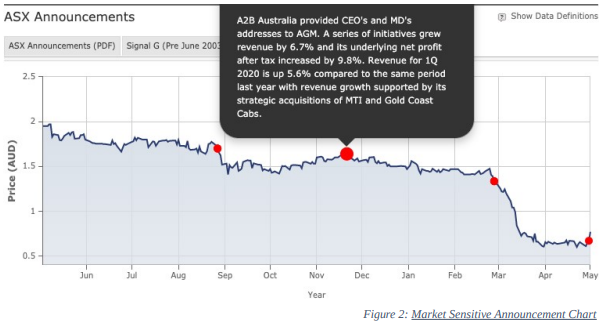
After acquiring MTI in 2018, A2B expanded its market reach regionally by purchasing Gold Coast Cab in July of last year (Annual Report 2021). As can be seen in the graph above, the share price remained stable at the time of the announcement in July. As of November 2019, the market’s stock values, despite some dips from June to October 2019, have been gradually rising. Investors have high expectations for this project, and its development is expected to meet or exceed them. It became apparent from the upbeat numbers presented that increased shareholder confidence as A2B expanded to the national level. It is the willingness of investors to take on more risk to invest more capital in an effort to generate higher returns while acknowledging that losses are more likely (James Chen 2020). According to the trend line in Figure 2, the capital endeavor was a success since it resulted in net revenue for FY21 that was higher than expected. Shareholders agree to take advantage of additional possibilities, as viewed through December 2021, to increase their returns.
Cost of Capital
The cost of capital is the rate of return that investors may anticipate to get from similar investments with the same risk and timescale. First and foremost, a risk measure must be established in order to define the relevant cost of capital. In this report, the key techniques that will be employed in determining the cost of capital will be the DGM and CAPM.
Cost of Equity – Capital Pricing Asset Model (CAPM)
The cost of equity are stockholders’ returns which are measured by how much a firm has to pay its stockholders. The cost of equity is often represented by the following formula:

Cost of Equity = Risk-Free Rate of Return + Beta × (Market Rate of Return – Risk-Free Rate of Return).
where; RE = Cost of Equity, Rf = Risk-Free Rate of Return, β = Beta of Stock (correlation between stock and market returns or systematic risk of security), and Rm-Rf = Market Risk Premium.
In this analysis, the 10-year Australian Government Bond is being utilized as the risk-free rate since the government is very unlikely to default on its debts and also it is considered to have the lowest risk possible. Using the Bloomberg quote, Rf used is 0.87 %. Using the Rm that was previously estimated in the risk analysis, 5.97 % will be used. Finally, Beta is determined using regression analysis, which yields a value of 0.4234 according to Appendix A.
Thus, the rate of return for CAPM is:
0.87 % + (0.4234) (5.97 %-0.87 %) = 3 %
Cost of Equity – Dividend Growth Model (DGM)
A constant projected dividend growth rate is assumed by the DGM. It is possible to estimate the cost of equity using DGM, as A2B is a dividend paying company. Based on the DGM, RE may be formulated as follows:

The variables used above, can be determined as follows:
- Po = Share Price – beginning of the year
- Div1 = Sum of the dividends for the reporting period. Both interim and final.
To compute the cost of equity in this model, the final and interim dividends for the relevant period are added together in Div1 as illustrated (Annual Report 2021). In the formula, P0 is the next element, and it can be described above or expressed as the prior year’s closing share price. The final component g which is the expected annual growth rate of the organization can then be predicted. DGM is used in this study, which means that the growth rate of corporations might change, but the growth rate of dividends will remain constant. Based on the 2021 financial year report, the closing price in 2020 was $2.40, making p0 = $2.40 (Annual Report, 2021). In addition, the intermediate and final dividends were each 4 cents (Annual Report, 2021, p.83), which points out to a total of 8 cents.
In such a case, g can be derived using the formula below:
g = Return on Equity (ROE) x (1 – Retention Ratio (Plowback Ratio)

In this case, the earnings per share (EPS) can be calculated as provided in the annual report as well as the shareholder equity, then inserted in the DGM formula to calculate the return on equity (Annual Report, 2021).
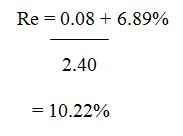
Therefore, Re based on the DGM value can be calculated as follows:
CAPM and DGM Evaluation and Comparison
Based on the preceding calculations above there is a noticeable discrepancy of about 7 % between CAPM and DGM when it comes to Re. There are several reasons for this, including the assumption that beta is constant in CAPM, which may be used to anticipate future returns. As a consequence, because beta is computed using historical data, which may fluctuate from one period to another, and because A2B’s share price has declined over time, CAPM is not an effective tool for the calculation of Re.
Even while DGM is not considered the picture-perfect model for calculating the cost of equity, based on the foregoing computations, it appears to be more favorable than CAPM. When developing the model, we considered a company’s dividend growth rate. According to the company’s annual reports, A2B has consistently paid dividends for the past five years, despite the company’s losses in 2017 and 2018, and even though dividend payments have fallen since 2018 and have not stopped to date.
Overall, it can be said that, based on the study of shareholders conducted in Part 1 and the models developed above, the investors are primarily non-marginal investors. As a result, this study makes the assumption that non-marginal investors prefer the DGM model over marginal investors, who favor the CAPM model. Although the DGM has its drawbacks, it is still a viable option. The corporation’s dividend growth rates are presumed to be predictable and steady by the DGM model.
Cost of Debt
When a firm borrows money, it must pay interest on that debt. This interest that is usually paid by the company is what is termed as the cost of debt. Because the non-current provisions and current borrowings are short-term liabilities, there is no long-term debt obligation for A2B to take into account (Annual Report, 2021). The non-current provisions include annual leave and long service leave provisions, which can only be recognized as liabilities if the event occurs and the provisions are utilized (Annual Report, 2021). As a result, A2B had no long-term debt in FY2021, as per the 2021 annual report.
Based on these facts, the total equity may be calculated using the following formula:
Total equity = Outstanding Shares x Share Price at the End of Year
Based on the yearly reports for the 2021 Financial Year, the outstanding share amounts to a total of 120, 430, 683 shares while the annual share price is about $1.77. From these figures the total equity for the company will be $ 213, 162, 309 (Annual Report, 2021).
Weighted Average Cost of Capital (WACC)
The weighted average cost of capital (WACC) is the average return that a company expects to pay its various shareholders. The weights show the percentage of each source of financing that the currency’s goal capital structure is aiming to achieve. Calculation of WACC is done in the following manner:
WACC = WERE + WDRD (1- t)
Final Closing Price x Number of Shares
____________________________________________
WE= (Final Closing Price x Number of Shares) + Firm′s Non−current Borrowing????
However, for the case of A2B, there seems to be no debt in their 2020 fiscal year and therefore, the WACC cannot be calculated as debt is also part of the above formula. Thus, it would be assumed that the value of WACC will be equal to that of cost of equity that has been computed above.
Financial Statements Analysis
The main aim for analyzing financial statements is to enable an easier evaluation of the strengths and weaknesses, profits and performance for the A2B company. This report will make use of the ratios that have been provided herein.
Introduction
- Market Value Added (MVA): It is claimed by Zafiris and Bayldon (1999), that the MVA assesses a firm’s value-creation by subtracting from the present market value of its capital the money invested in the company at the time of such investment.
- Market-to-Book Value Ratio (MBV): The value of MBV can be used to calculate the value that has been added for each dollar that the shareholders have invested in the company.
Additionally, there are other two operating returns that will be used to measure performance for the A2B company. This is:
- Return on Equity ratio (ROE): It is used to estimate the income of the shareholder per one dollar that they have invested in the company.
- Return on Assets (ROA): It uses both the DuPont and Normal formula analysis to evaluate how profitable the company is in relation to their total assets.
The last section of this part will evaluate the competitor’s ratio analysis.
There are two groups of account users. In the first place, there are individuals who have a vested interest in the well-being of business operations, such as the business’s proprietors, suppliers, workers, and clients. The second group of users is made up of those having a less direct stake in the company, such as financial advisors and regulators, as well as competitors.
Calculations and Time Series Analysis
Market Value Added
There is a need to figure out the market capitalization first before calculating the value of the market value added.
Therefore,
Market capitalization = Number of Shares Outstanding x Closing Stock Price
=120 430,68344 x 1.7743
=$ 213, 162, 309
Thus,
MVA = Market Capitalization – Book Value of Equity
= 213,162,309 – 163,909,000
=$ 49,253, 309
Table 4.2.1
The MVA figures shown above is based on the total value of the company’s stockholders’ investments. A2B stockholders have invested $163,909 million (Annual Report, 2021, p.47) in MVA throughout the years, accumulating $ 49,076,309 million in value over the years with the shares now being priced at $213,162,309 million. When looking at the past years’ time series analysis (as shown in Table 4.2.1), it is clear that the market capitalization and MVA increased from 2018 to 2020 before rapidly declining in FY 2021. At the end of both 2018 and 2019, the amount of long-term loans and borrowings dropped from $106 million to zero. The fall in book value of equity at A2B, as a result of fewer liabilities, contributed to the rise in MVA between 2018 and 2020.
The decline in the share price from $ 2.40 in 2018 to $1.7748 in 2021 may be the cause of the large decrease in FY 2021 (Annual Report, 2021, p.44). Since the EPS is calculated using the statutory net profit after tax, it has been shown that the latter has decreased over time while the number of outstanding shares has remained constant. This fact is also supported by the reports and depicts the exact state of the A2B company currently. The drop in MVA may be explained if the share price moves in the same direction as the EPS. As a result of the difficulties that A2B has experienced, the positive MVA in FY 2021 shows A2B’s dedication to shareholder value.
A2B appears to have a satisfactory MVA, but we can get a better sense of if the shareholder’s value is satisfactory by calculating the Market-to-Book Value Ratio (MBV).
The value of Market-to-book value Ratio is computed using the formula below:
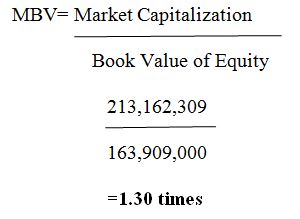
From the above calculation, it is clear that A2B shareholder value has been multiplied by a value of 1.30 which illustrates that the company is performing effectively.
Table 4.2.2 depicts a trend analysis of the MBV from 2018 to 2021, revealing various shifts in the trend line. After growing by a factor of one in 2018, the value shareholders received for their money increased by a further factor of one in 2019 and 2020, before declining somewhat in 2021. It is noted on page 27 of the annual report of 2019 that a special dividend of $96,300,000 was paid out, which has increased the MBV for 2019. Since share prices were expected to decline by 2020, this ratio will grow. While A2B’s shareholders’ value has increased, the company has maintained a solid MBV.

Therefore, the ROE value can be computed as follows:
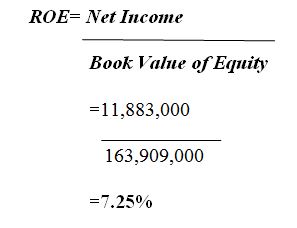
Since the ROE for FY 2019 is about 7.25% while their CAPM is 3%, it can therefore be concluded that A2B is providing satisfactory returns to their shareholders which is nearly 4% or higher.
Table 4.2.3

Calculating return on assets (ROA) allows for an overview of how well management is using the company’s resources in order to create profits. The ROA will be calculated using two formulae in this report.
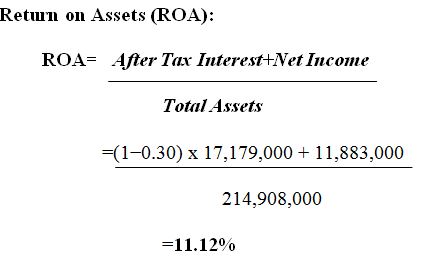
Similarly, the value of ROA can also be computed using the DuPont analysis, with the formula used being Asset Turnover x Operating Profit Margin. In this case, the aim of using the asset turnover is to see the proficiency of the asset of the company and their subsequent operating profit margins.
Return on Asset (DuPont System)
ROA= Asset Turnover x Operating Profit Margin
Where:
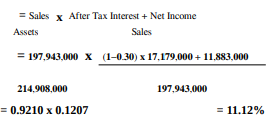
As it can be seen, the answer is the same to the ROA value computed above. The table below depicts the ROA progression for the A2B company since 2018.
Table 4.2.4

According to the data shown above, the decline from 8.35 percent in 2018 to –34% in 2019 was noteworthy. A net loss of $90,550,000 in the fiscal year 2019 has led to this adjustment in the company’s profitability efficiency (Annual Report, 2021, p.24). There was also a loss on ceased operations of roughly $104,251,000 in 2019, according to the company’s annual report. A statement on page 84 of the 2019 annual report said that the ceased activities had lost money. Additionally, the overall assets for the fiscal year 2019 have decreased as well. There was a 0.18% increase in the ROA in 2018 compared to 2019. The profit for FY 2021 reflected the improvement in the discontinued operations loss and revenue, and the improvement was encouraging, with a Return on Assets of 11.12 %.
Cross-Sectional Analysis
In this section, we will examine how A2B stacks up against one of its main competitors, Lindsay Australia Ltd. (LAU). Using this benchmarking data, A2B will be able to better understand where it stands based on areas like Size, Age, Sector and Scope of operations in the market and how to improve its position there. Comparing A2B’s strengths and weaknesses to those of its main rival is made simple with the help of the competitor’s ratio analysis shown below.
Table 4.3.1
A2B appears to be the most valuable company based on its current market capitalization. These data may be explained by looking at the share prices, which are different. Share prices for LAU and A2B were, for example, $1.77 and $0.345, respectively, in FY 2021. During the period from 2018 to 2021, the number of shares issued grew, but the price of the company’s stock fell. In other words, if we go by what has already been mentioned, A2B is almost twice as large as LAU. A2B was founded in 1976, whereas LAU was founded in 1993 and formally listed on the ASX in 1994. There is a good chance that A2B outscored LAU since they have greater expertise in the industry.
As a measure of profitability, the ROE provides insight into the capabilities of A2B and LAU to make profits. While A2B was able to generate a positive ROE in FY 2021, LAU beat A2B as the business had a positive and rising ROE, whilst A2B had a negative ROE for the year. As a result, A2B must ensure that it can enhance its net income in the years to come. In addition, due to the loss, A2B had a negative ROA of 34% in FY 2019, but after that, A2B was able to offer a positive ROA, and in FY 2021, A2B produced roughly double the ROA of LAU. However, despite the fact that LAU has never had a negative ROA, it has not been able to beat A2B. A2B has had a difficult year, but it has rebounded quickly since the ratios for FY 2021 are optimistic, and so, the future of A2B is bright if it continues to improve its performance in FY 2021.
References
A2B AUST FPO (A2B.AX) Company Profile & Facts – Yahoo Finance. 2020. Yahoo! Finance. Yahoo! Web.
A2B.AX – A2B Australia Ltd Profile, 2020. Reuters. Thomson Reuters. Web.
Annual Report., 2019. Web.
Basic Investment Objectives., 2019. New York: Newstex. Web.
Chen, James.2020. Risk Return Trade-off. Web.
Farmantra., 2019. Who Are The Marginal Investors In Your Company? Web.
Fontinelle, Amy., 2019. Systematic Risk. Web.
Market Index., 2020. All Ordinaries. Web.
Morningstar, Inc., 2020. Morningstar. Web.
Morningstar. 2019. Curtin University Library. Web.
Simply Wall St., 2020. What Is A2B Australia’s (ASX: A2B) P/E Ratio After Its Share Price Tanked? Simply Wall St. Web.
The Economics Times., 2020. Risks. The Economics Times. Web.