Introduction

Analysis
The demographics presented provide information that is crucial to determining fertility levels of women across the United States. The fertility rates of various groups are calculated using the Crude Birth Rate (CBR) method, the General Fertility Rate (GFR) method, the Age Specific Fertility Rate (ASFR), and the Total Fertility Rate (TFR) method.
Crude Birth Rate (CBR)
The calculations show that the number of births per 1000 women reduced from fourteen to twelve between 2000 and 2010. The causes of such a reduction could be an increased interest in corporate life by contemporary women, increased awareness of birth control methods, and a constrained economy. It is worth noting that although the birth rates increased slightly in 2005 across the three groups, there was a significant reduction in birth rates in 2010.
General Fertility Rate (GFR)
The general fertility rate data shows that the general fertility of the female population between the age of 10 and 54 reduced from 28 births per 1000 potential mothers to 25 births per 1000 women who were in a position to conceive. The findings show that the number of births by women who would be considered fertile reduced as people got more accustomed to the new millennium.
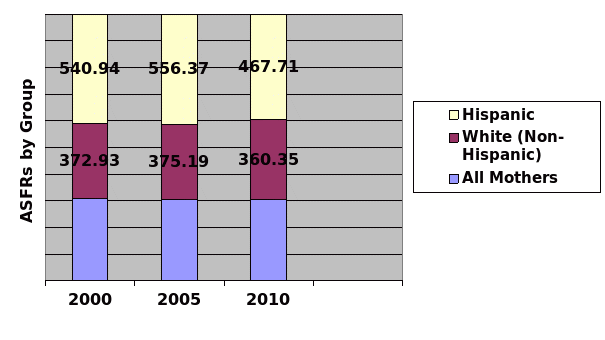
Age Specific Fertility Rate (ASFR)
The Age specific Fertility Rate measures the women’s ability to give birth by measuring the number of births per 1000 women within a 5-year age-group between the age 10 and 54. Across the years, it is evident that fertility was most prominent between the ages of 20 and 34. In 2005, the ASFR of 1000 women aged 20 to 24 reduced to 101 births per year from 109 births per year. However, the ASFR value increased by 2 for women between the ages of 25 and 29, and by 5 between the ages of 30 and 34. In 2010, the ASFR reduced significantly for young women between the ages of 20 and 29. The change can be attributed to the recession that hit the United States, which may have prompted women to venture into the corporate world to increase their disposable income.
The data showed that the White (Non-Hispanic) women had a moderate birth rate across all age-groups compared to the Hispanic women. The data showed that the fertility rates of the Hispanic women started from a very young age (14 years). In 2000, the ASFR of Hispanic women between the ages of 20 to 24 years was almost double the ASFR of White (Non- Hispanic) women of the same age-group (159 births per year compared to 90 births per year). As with other parameters, the Age Specific Fertility Rate also increased across the groups in 2005. There was a considerable increase in the births per 1000 women aged between 14 and 35 across the designated groups. In 2010, the rate reduced for all groups, which could mean that the Hispanic women were more educated on birth control methods and family planning.
Total Fertility Rate (TFR)
The total fertility rate is the number of times a fertile woman gives birth within her lifetime. In 2000, the total fertility rate was 2.06. It remained stable until 2010 when it reduced to 1.9 births per 1000 women. The drop depicts a shrink in population over the years. However, this depends on the prevailing mortality rates. The total fertility rate for the White (Non-Hispanic) mothers remained stable at 1.8 births per 1000 women across the years. The TFR of the Hispanic mothers reduced from 2.7 in 2000 and 2005 to 2.3 in 2010. The data shows that Hispanic women became more literate as years passed and factors such as job availability, quest for education, the economy, and personal goals affected their rate of birth across the age-groups.
Conclusion
As evidenced in the analysis, the most effective parameter for forecasting fertility is the Age Specific Fertility Rate method. The ASFR method allows one to draw comparisons across age-groups and races in a given population. It also enables one to compute the Total Fertility Rate, which is a popular measurement tool for governments.