Alcohol Consumption Among Students: Linear Regression and Correlation Essay

Exclusively available on Available only on IvyPanda® Made by Human No AI

In this study, the researchers utilized multiple linear regression to identify the relationship between alcohol consumption and the characteristics of the neighborhood. The dependent variable for this study is alcohol consumption among students (Freitas et al., 2020). The study has five independent variables; firstly, is people often get mugged, robbed, or attacked in the neighborhood. Secondly, people in my neighborhood look out for each other and thirdly, people sold or used drugs in the neighborhood. Fourthly, people in my neighborhood generally got along with each other, and lastly, I feel safe being out alone in my neighborhood during the night.

From table 1.0, the value of R square is 0.026, which means that 2.6% of the variation on students drinking alcohol can be explained by the combined variation of people in neighborhood getting along with each other, people sell or use drugs in the neighborhood, I feel safe being out alone in my neighborhood, people often get mugged, robbed or attacked in my neighborhood, and people in my neighborhood could be trusted. However, the adjusted R square, which considers the number of variables and the sample size, shows that only 0.3% of the variation in the dependent variable can be explained by combined variations of the dependent variable (Ramachandran & Tsokos, 2021).

From table 2.0, the p-value is 0.342, which is greater than 0.05. This means that the regression analysis is not significant to explain the dependent variable using the independent variables (Maneejuk & Yamaka, 2020). From the correlations results in table 3.0; I feel safe being out alone in my neighborhood, people often get mugged, robbed or attacked in my neighborhood, and people in my neighborhood generally got along with each other have a weak positive correlation with how often do you have a drink containing alcohol? People sell or use drugs in my neighborhood, and People in my neighborhood could be trusted has a weak negative correlation with how often do you have a drink containing alcohol? (da Silva Filho et al., 2021).

Table 1.0: Model summary

Model Summaryb
ModelRR SquareAdjusted R SquareStd. Error of the EstimateChange Statistics
R Square ChangeF Changedf1df2Sig. F Change
1.161a.026.0031.093.0261.1385214.342
a. Predictors: (Constant), People in my neighborhood generally got along with each other., People sell or use drugs in my neighborhood., I feel safe being out alone in my neighborhood during the night., People often get mugged, robbed or attacked in my neighborhood., People in my neighborhood could be trusted.
b. Dependent Variable: How often do you have a drink containing alcohol?

Table 2.0: ANOVA

ANOVAa
ModelSum of SquaresdfMean SquareFSig.
1Regression6.78951.3581.138.342b
Residual255.4432141.194
Total262.232219
a. Dependent Variable: How often do you have a drink containing alcohol?
b. Predictors: (Constant), People in my neighborhood generally got along with each other., People sell or use drugs in my neighborhood., I feel safe being out alone in my neighborhood during the night., People often get mugged, robbed or attacked in my neighborhood., People in my neighborhood could be trusted.

Table 3.0: Coefficients

Coefficientsa
Model
1
(Constant)I feel safe being out alone in my neighborhood during the night.People often get mugged, robbed or attacked in my neighborhood.People sell or use drugs in my neighborhood.People in my neighborhood could be trusted.People in my neighborhood generally got along with each other.
Unstandardized CoefficientsB2.683.070.029-.111-.227.208
Std. Error.435.089.108.090.130.152
Standardized CoefficientsBeta.061.024-.104-.179.141
t6.167.789.265-1.229-1.7431.370
Sig..000.431.791.221.083.172
95.0% Confidence Interval for BLower Bound1.825-.105-.184-.289-.484-.091
Upper Bound3.540.245.242.067.030.507
CorrelationsZero-order.074-.059-.099-.052.022
Partial.054.018-.084-.118.093
Part.053.018-.083-.118.092
a. Dependent Variable: How often do you have a drink containing alcohol?
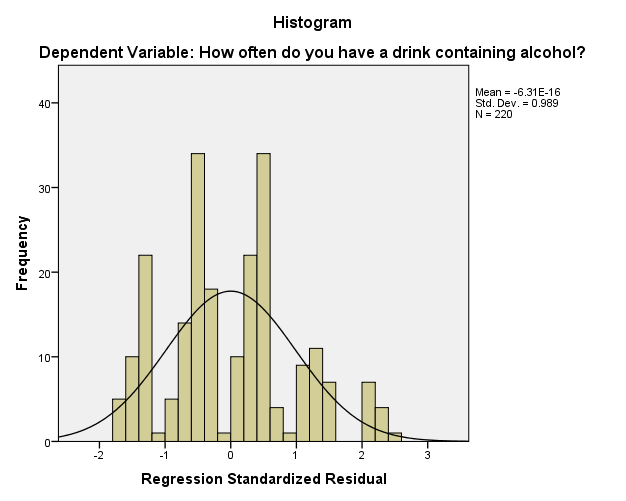
Dependent variable histogram
Graph 1.0: Dependent variable histogram

References

da Silva Filho, A., Zebende, G., de Castro, A., & Guedes, E. (2021). Physica A: Statistical mechanics and its applications, 562, 125285. Web.

Freitas, H., Henriques, S., Uvinha, R., Lusby, C., & Romera, L. (2020). International Journal of the Sociology of Leisure, 3(4), 389-399. Web.

Maneejuk, P., & Yamaka, W. (2020). Journal of Applied Statistics, 48(5), 827-845. Web.

Ramachandran, K., & Tsokos, C. (2021). Linear regression models. Mathematical Statistics with Applications in R, 301-341. Web.

More related papers Related Essay Examples
Cite This paper
You're welcome to use this sample in your assignment. Be sure to cite it correctly

Reference

IvyPanda. (2022, December 18). Alcohol Consumption Among Students: Linear Regression and Correlation. https://ivypanda.com/essays/alcohol-consumption-among-students-linear-regression-and-correlation/

Work Cited

"Alcohol Consumption Among Students: Linear Regression and Correlation." IvyPanda, 18 Dec. 2022, ivypanda.com/essays/alcohol-consumption-among-students-linear-regression-and-correlation/.

References

IvyPanda. (2022) 'Alcohol Consumption Among Students: Linear Regression and Correlation'. 18 December.

References

IvyPanda. 2022. "Alcohol Consumption Among Students: Linear Regression and Correlation." December 18, 2022. https://ivypanda.com/essays/alcohol-consumption-among-students-linear-regression-and-correlation/.

1. IvyPanda. "Alcohol Consumption Among Students: Linear Regression and Correlation." December 18, 2022. https://ivypanda.com/essays/alcohol-consumption-among-students-linear-regression-and-correlation/.


Bibliography


IvyPanda. "Alcohol Consumption Among Students: Linear Regression and Correlation." December 18, 2022. https://ivypanda.com/essays/alcohol-consumption-among-students-linear-regression-and-correlation/.

If, for any reason, you believe that this content should not be published on our website, please request its removal.
Updated:
This academic paper example has been carefully picked, checked and refined by our editorial team.
No AI was involved: only quilified experts contributed.
You are free to use it for the following purposes:
  • To find inspiration for your paper and overcome writer’s block
  • As a source of information (ensure proper referencing)
  • As a template for you assignment
1 / 1