Executive Summary
Hesketh & Brown is a company engaged in the manufacture of various products. The company has three manufacturing facilities namely, Kenyon Meaney, Marshall Fearon and Swarbrick Hattersley. There are 52 different types of products that are manufactured in these facilities. The products have different costs, sales prices and quantum of sales.
The motive of this report is to review all the products in terms of their profitability. It shall also be understood whether products that involve more labour intensive jobs are less productive or not. Another aspect to be researched is the effect of the profit margin on the overall profits. And finally, we shall discuss the benefits of conducting a survey for new products to be launched.
Assignments # 1 & 2
From the figures in the given excel sheet, it is understood that the profit margin that has been added to the net cost of products is different for each and every product. The following figures and the ensuing chart depict the profit margin of each product in the Kenyon Meaney range of products.
Table 1: Profit Margin of Kenyon Meaney
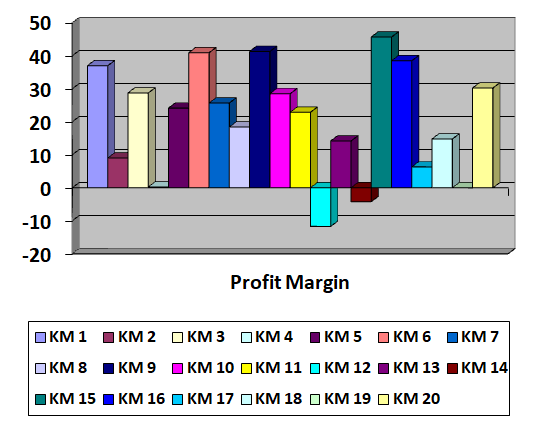
It is evident from the graph that there is no fixed criterion for profit margin being added on the net cost. The profit margin ranges from -11.69% to 45.67%. Moreover, there are three products that have been sold at a loss. These products are KM 12, KM 14 and KM 19.
From the figures in the given excel file (hb.xls), it can be understood that in these three products, the labour cost is 1.6 to 1.8 times higher than the material cost. This should imply that if the labour cost is more than the material cost of a product, then the profit margin is in the negative or is less.
But there are certain products that defy this logic. As for example in KM 15, the material cost is £5.44 whereas the labour cost is £15.56 i.e. 2.86 times more than the material cost.
But the figures show that the profit margin for this particular product is 45.67%. Similar relation can be found in products like KM 2, KM 4, KM 5, KM 7, KM 11, KM 13, KM 16, KM 17 and KM 18. So it will not be appropriate to establish that if the labour cost is more than the material cost, the profit margin will be less.
The following figures and the ensuing chart depict the profit margin of each product in the Marshall Fearon range of products.
Table 2: Profit Margin of Marshall Fearon.
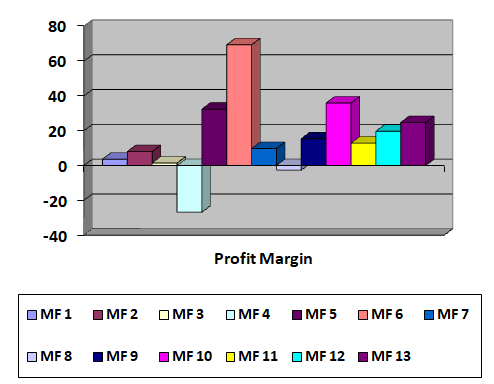
In the Marshall Fearon range of products also, we see that two of the products have been sold at a loss. These are MF 4 and MF 8. The labour cost of these two products is also more than the material cost.
But again, examples where the labour cost is more than the material cost can be found here also and such products have made profit namely, MF 1, MF 2, MF 3, MF 5, MF 6, MF 7, MF 9, MF 10, MF 11, and MF 12. It is noteworthy to mention that in this group of products, MF 13 is the only one where the labour cost is less than the material cost.
The following figures and the ensuing chart depict the profit margin of each product in the Swarbrick Hattersley range of products.
Table 3: Profit Margin of Swarbrick Hattersley.
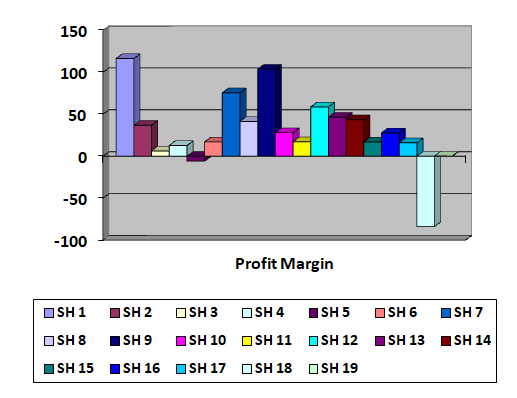
In the Swarbrick Hattersley group of products also we have two products that have been sold at a loss namely, SH 5 and SH 18. Again, the labour cost is more than the material cost. But it is alarming to note that in product SH 18, the labour cost is 20.75 times the material cost. This has obviously reflected in the sales that have been done at a loss of 83.59%.
In order to know the performance of all the three factories, it would be a better option to compare their total sales and the overall profit margin. The following chart shows the details:
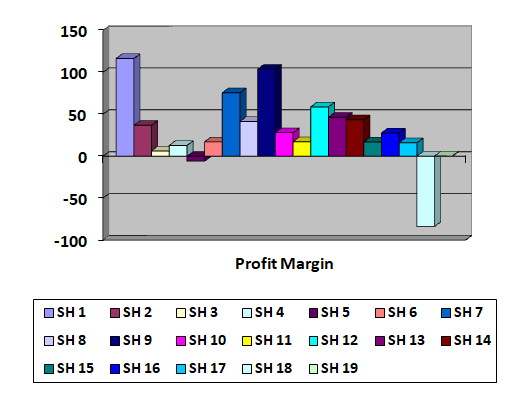
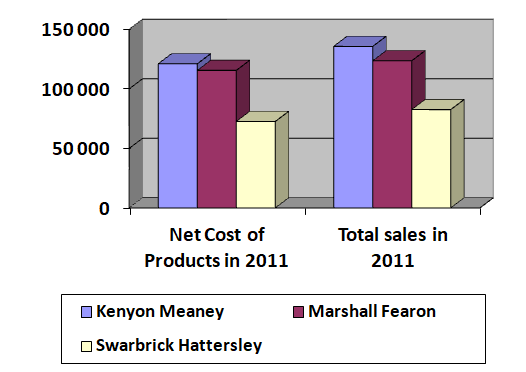
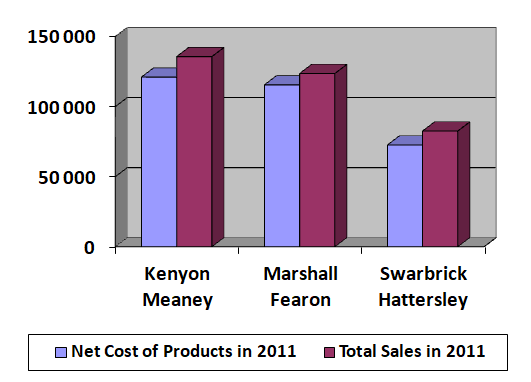
To further understand the performance comparison of the three factories let us make another graph that will show us the relation between the net cost of the products and the total sales of 2011. The following two charts show us the comparison. Please note that figures (values) are the same but in both the graphs, the presentation is different.
There are certain entries in the given excel sheet that I feel are erroneous. I would like to mention these just in case they need to be edited. I have tabulated the entries to make it easy for the reader to understand.
Table 4: Errors observed.
Another major error (supposedly) that I noticed is the huge difference in the labour cost and the material cost. It is understandable if all the products of a particular factory have the same tendency. But if this feature is noticed in only a few of the products, means that there is some error in the data.
There is one such product that needs a thorough checking. In product SH 18, the material cost is £3.82 whereas, the labour cost for the same is £79.30. I am sure that due to this very reason, the product has incurred heavy losses.
Assignments # 3
It’s true that if a product has a high profit margin, it is not necessary that the product will give high profits. It all depends on the sales made for that particular product. It’s simple calculation. More the sales more will be the profits.
Moreover, even if a product has a less profit margin but the sale of this particular product is high, then the total profit from this product may be more than the one which has higher profit margin but fewer sales. We shall take two examples from each factory to understand this.
Out of the two, one will be with higher profit margin but less sales and another with less profit margin but higher sales. Then we shall see the total profit the two products have made. Let us start with Kenyon Meaney factory.
Product KM 15 has a profit margin of 45.67% but the sales for this product have been only 22 units. The annual profit earned from this product was £325. Product KM 2 has a profit margin of 9.01% but the sales for this product have been 383 units. The annual profit earned from this product was £950.
In Marshall Fearon factory, product MF 6 has a profit margin of 69.39% but the sales for this product have been only 87 units. The annual profit earned from this product was £629. Product MF 11 has a profit margin of 12.86% but the sales for this product have been 1445 units.
The annual profit earned from this product was £2579. In Swarbrick Hattersley factory, product SH 10 has a profit margin of 28.22% but the sales for this product have been only 79 units. The annual profit earned from this product was £539.
Product SH 11 has a profit margin of 17.31% but the sales for this product have been 203 units. The annual profit earned from this product was £808. Hence, we see that the total profit is not dependant on the profit margin. It is the sales that make the difference.
Assignments # 4
Doing a survey of new products or even the existing ones is always beneficial, provided it is done in a well planned and organized manner. “Companies use marketing research surveys to garner many types of information from the consumers and business customers.
Businesses gather this information prior to introducing products, but they acquire the majority of customer data after they have introduced products” (Suttle). The most important factor in a survey is the manner in which the questionnaire is formulated. What sorts of questions are included in the questionnaire?
What kinds of answers are required for the questions? Whether a simple yes or no will suffice or descriptive answers are required. Another factor is the length of the questionnaire. How much time will a person need to answer all the questions?
It is advisable to keep the questionnaire small so that within 20 to 25 minutes, all the questions can be answered. Apart from the questionnaire, the population that is to be targeted also makes a difference. Another factor is the way in which the survey is being conducted.
Whether the questionnaire is to be sent by emails or people are to be met personally. It is understood that about 75% of the company’s sales are through 20 companies alone. Taking the opinion of these companies will help only if the companies are the end users of the products.
Otherwise, there is no point in asking them for their views on any new products to be launched. If the new products are ultimately to be launched in the market, the general public will be a better judge and they only will be able to give a frank opinion.
Conclusion and Recommendations
After going through all the details and results, it is understood that out of the three factories of Hesketh & Brown, the overall performance of Kenyon Meaney factory is the best. Then comes Marshall Fearon factory and the worst performance is of Swarbrick Hattersley factory. But it doesn’t mean that the Kenyon Meaney factory’s performance is satisfactory.
There is always a scope of improvement. The management should lay more stress on the Swarbrick Hattersley factory and try to bring it at par with the Kenyon Meaney factory. The same applies to the Marshall Fearon factory. It also needs lots of changes and improvements.
There are many alarming figures in the excel sheet. If these are discrepancies, immediate editing should be done. But God forbid, if the figures mentioned are correct, the production of the related products should immediately be stopped. Also, there should be a set pattern to calculate the sales price.
The profit margin for all the products should be fixed. The present system is very confusing. As we have seen earlier in the paper, the profit margin range is to the extreme.
It seems that no qualified accountant is there to assist the management in all such works. So the first step towards improving the performance of the company is to appoint a well qualified and experienced full time accountant.
Works Cited
Suttle, Rick. 2012. The Importance of Customer Feedback. Web.