Introduction
Financial ratio analysis is an important step in analyzing the company’s performance and development. Companies operating in all types of markets can benefit from financial ratio analysis, as it allows tracking the progress and benchmarking against major competitors. As noted by Ingram (n.d.), financial ratios offer a standardized method for comparing company performance historically or across the industry. Different types of financial ratios focus on a variety of performance outcomes. For example, while the gross profit margin helps to evaluate the overall profitability of the company, investor return measures such as dividend yield and dividend payout help to evaluate investment opportunities with a company (Dyer, Godfrey, Jensen, & Bryce, 2016). Overall, performing a comprehensive financial ratio analysis on Apple helps to understand the major trends affecting the company’s future and current performance.
Performance Ratios
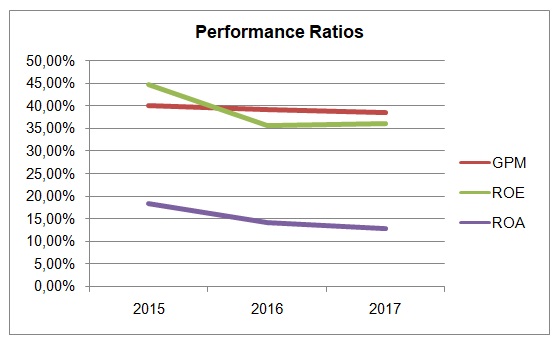
Figure 1 shows the key performance ratios for Apple between 2015 and 2017. Gross profit margin, return on equity (ROE), and return on assets (ROA) were calculated for Apple based on its 10-K Report (Apple Inc., 2017) and 2015 Annual Report (Apple Inc., 2015). The gross profit margin of Apple Inc. decreased from 40.06% in 2015 to 38.47% in 2017. Similarly, the ROE and ROA decreased from 44.74% to 36.07% and from 18.38% to 12.88%, accordingly. These changes are indicative of the general market situation, as similar trends can be observed in Samsung (“Samsung Electronics Co Ltd”, 2018) and Microsoft (“Microsoft Corp”, 2018). Moreover, the company’s gross profit margin is still considerably higher than that of Samsung, placing it in a favorable competitive position. Compared to Microsoft and Samsung, Apple Inc. demonstrates higher ROA and ROE assets. These ratios are used to indicate how effective the company uses its assets and the equity capital (Dyer et al., 2016). Therefore, financial performance ratios show that Apple Inc. has a stable position in the market and there are no concerns related to its profitability or the use of resources.

Slack Measures
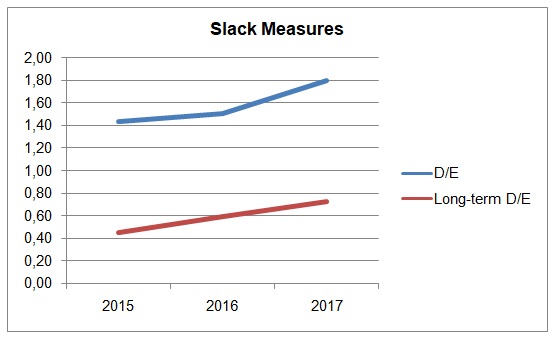
The debt-equity ratio and long-term debt to equity is described by Dyer et al. (2016) as slack measures, as they show the company’s flexibility for growth and development. Apple’s debt-equity ratio in 2017 was 1.80, which is worse than the 2015 figure of 1.43 (Dyer et al., 2016). It is also significantly higher than the ratios produced by its key competitors (“Samsung Electronics Co Ltd”, 2018; “Microsoft Corp”, 2018). However, as seen in Figure 2, the steep increase in D/E in 2017 did not correlate with an increase in long-term debt to equity; thus, the reason for such a high D/E ratio is probably short-term obligations or payables, and the ratio will improve in the next fiscal year. However, benchmarking the D/E and long-term debt to equity ratios against key competitors could help the company to improve flexibility.

Operating Efficiency Measures
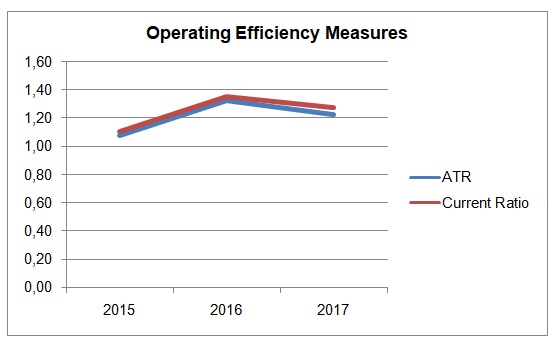
The acid test ratio and the current ratio of Apple Inc. are shown in Figure 3. According to Dyer et al. (2016), the rule of thumb is for the acid test ratio and the current ratio to be above 1 and 2, respectively. Apple has an acid test ratio of 1.23, whereas its current ratio is 1.28. Comparing the ratios shows that the company’s inventory represents a small share of its current assets, which might become a problem if the volume of other current assets decreases. Compared to Microsoft, Apple’s ATR and current ratio is rather weak (“Microsoft Corp”, 2018). Improving the volume of current assets by increasing inventory could help to ensure that the company has no liquidity issues.

Conclusion
The analysis shows that Apple’s performance has remained consistently positive over the past few years, with only minor concerns to be addressed. In particular, the weak share of inventory in the company’s current assets affects its current ratio and might result in liquidity issues if unaddressed. However, when compared to its main competitors, Samsung and Microsoft, Apple Inc. occupies a stable market position and has great performance outcomes.
References
Apple, Inc. (2015). 2015 annual report. Web.
Apple, Inc. (2017). 10-K report. Web.
Dyer, J., Godfrey, P., Jensen, R., & Bryce, D. (2016). Strategic management: Concepts and tools for creating real-world strategy. Hoboken, NJ: John Wiley & Sons.
Ingram, D. (n.d.). The advantages of financial ratios. Web.
Microsoft Corp. (2018). Web.
Samsung Electronics Co Ltd.(2018). Web.