Introduction
Apple’s lifecycle can be described as dynamic because it can change in period provided that the firm successfully launches a new product. Apple’s relatively low business cycle operates opposite to the economic trend. There is a high product differentiation in the industry. Differentiation allows firms to charge prices above the average cost of production. Firms are able to report economic profits.
The firm’s stock intrinsic value is several times higher than the market price. The main strength of the DCF (firm valuation) model is that it uses expected future cash flows instead of historical data on cash flows. Its main weakness is relying on a single year to forecast cash flows. The ROCE, EVA, SVA and RI measure value added in terms of economic profits.
Economic Analysis
Business Cycle Justification
Apple’s relatively low business cycle operates against the economic trend. Apple performed well against the economic recession of 2008-2010 as portrayed in its financial statements. Apple is experiencing a relatively low business cycle (Apple, Inc., 2013). Its low business cycle is relative to the high business cycle it experienced a few years ago.
The consumer electronics industry has the characteristics of a monopolistic competitive market. There are very many companies with differentiated products (Hunt, 2011). Apple operates in the smartphones, computers, tablets and associated accessories subsector. The relatively low business cycle can be attributed to the inability of the firm to launch new products successfully in recent years.
Relevance of Economies Analyzed
Most economies around the globe have recovered from the global financial crisis. Apple relies on a global market to drive its sales. When arranged by sales volume, its sales rely on the Americas, Europe, China, Japan, and the rest of the world (Apple, Inc., 2013). The U.S. and China are the countries with the highest consumption portion.
Emerging markets are becoming major consumers as the households’ income levels increase (Gereffi, 2014). In recent years, the emerging economies have reported high economic growth rates. The rate of technology adoption has also increased in emerging economies (Parrilli et al., 2014).
As a result, the emerging markets are also becoming exporters of manufactured goods (Gereffi, 2014). Production of manufactured goods is becoming increasingly outsourced. Parts are produced in different countries before they are assembled in another country (Ali-Yrkko et al., 2011).
Industry Analysis
Lifecycle Model Justification
Apple’s high growth rate cycle appears to be declining. The main reason can be its reliance on the success of its two product major differentiated products, which are iPads and iPhones. The major products can be described to be on a maturity stage in the product life cycle.
Apple’s lifecycle can be described as dynamic because it can change at any time provided that the firm is successful with its R&D developments. Levie & Lichtenstein (2008) suggest that it is difficult to distinguish the stages of the lifecycle model in some firms.
Apple may appear to be undergoing a low business cycle. In contrast, a slow growth lifecycle would mean that the firm will be unable to experience high growth rate without restructuring. Apple can still grow at a higher rate if launches a new product successfully.
Analysis Using Porter’s Five Competitive Forces
Intensity of rivalry depends on the number of firms and their sizes (Porter, 2008). Intensity of rivalry is very high because there are many firms with multiple differentiated products. The firm’s brand name offers competitive advantage.
The threat of new entrants is high because firms in the electronics industry can easily switch between products.
The bargaining power of suppliers is low because Apple and Samsung are the main competitors with a large market share on related products. The bargaining power of suppliers is reduced when the buyers are a few large companies (Porter, 2008).
The bargaining power of buyers is high because of low switching costs (Porter, 2008). Customers can easily purchase from different brands. Customer service and warranty periods may have a strong influence in advanced economies. However, customer service can be easily imitated by competitors.
The external threat of substitutes is low between phones, computers and tablets. However, the products are easily substitutable amongst themselves. The threat of substitutes can be considered to be high.
Weaknesses and Threats to the Industry and the Company
Weakness
The main weakness is that large firms have to spend large amounts continuously on R&D to maintain their market share. Advertising costs are high as a result of higher product differentiation.
Threats
The main threat is that the company’s brand can easily be diminished if it does not launch new products successfully for a long period. A good example is the Motorola brand that diminished from staying for a long period without new product development. It shows that brands’ value can be very high. They have to be written off against shareholders’ value when their value falls (Shoesmith, 2004).
Company Analysis
Competitor Analysis
There is a high product differentiation in the industry. The main competitors are Samsung, Lenovo, and others. There are firms that have more than 10 differentiated products in the smartphone category. Apple has several iPad models. Hunt (2011) discusses that firms that use differentiation may generate economic profits if they lead the industry in differentiating products.
The main reason for generating supernormal profits is that firms with differentiated products can charge a higher price than the economic equilibrium price (Hunt, 2011). Apple is a beneficiary of the trend of leading in differentiation. There is heterogeneity of demand and the firm that differentiates its product effectively may add new segments to its market share.
However, the firm will need to increase its marketing costs. Holcombe (2009) demonstrates that the standardized product theory, which seeks to minimize costs, is sometimes different from the profit-maximizing structure of a differentiated product. Firms in the industry compete to develop superior products before they use a skimming price. Industry leaders earn supernormal profits.
Risks and Threats to the Company
Risks
Weak intellectual property rights enforcement laws in China can reduce its sales in the region.
Threats
Rivalry may intensify from emerging markets. Samsung’s success in new product development may reduce Apple’s market in the smartphone and tablet segments. Lenovo’s low-cost developments may intensify rivalry in computer sales.
Determination of Intrinsic Value
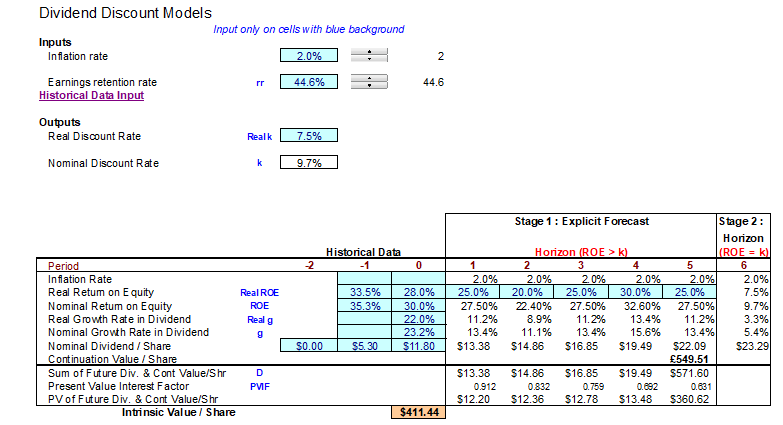
Using DDM, Apple’s stock intrinsic value is $411.44 (see Picture 1). It is $321 under the discounted cash flow model. The current stock market price is $95.57 (as on August 8, 2014). It shows that the market price is undervalued by investors.
The DCF (firm valuation) has been derived from the SVA because they share a common formula (Damodaran, 2012). It is obtained by dividing the firm’s NPV by the number of shares (see Picture 2).

Justification of Figures Employed
According to the Board of Governors of the Federal Reserve System (2014), the inflation rate is 0.68% for the period covered in 2014. It is rounded off to 2% after adding 1% to 0.68%.
The retention ratio may represent some of the attributes of the growth rate. However, it is not a good measure of the expected growth rate. Moles et al. (2011) suggest that internal growth rate (IGR) derived from retained earnings is a better measure of the highest possible rate of growth.
IGR is obtained by expressing the additions to retained earnings as a percentage of the initial assets. It shows the highest growth rate that a firm can achieve without borrowing. Apple’s IGR is about 1.68%.
The retention rate has been calculated by deducting dividends from net income and then dividing by net income. Dividends have been calculated by multiplying dividend per share by the number of shares.
Retention rate = (net income – dividends) / net income
Retention rate = $millions (37,037 – 20,520) / 37,037 = 44.59%
Retention rate is used because a firm’s growth rate is affected by the size of net income that is injected back in the firm’s capital.
Growth projections have been applied in the DDM calculations. The ROE is expected to follow a cyclical pattern of ups and downs that range between 20% and 30%. It follows Apple’s past and present trends. Apple has not launched a major product in 2014. The downward trend may continue in the first two years of the forecast.
Beta used in the calculations is the one provided by Yahoo Finance (Apple Inc. (AAPL), 2014). The beta provided in the spreadsheets is 1.30 and the one provided by Yahoo Finance is 0.74. Using a beta of 1.30, results in a higher WACC that makes EVA and RI to have negative values. A beta of 0.74 is better because Apple’s performance has not been aligned with the market conditions in the past few years.
Apple has outperformed the markets for several years. As a result, using a lower beta is justified. The weakness of beta provided by market analysts is that it may vary among analysts. They also change over time (Ray, 2012).
Critical Evaluation of the 2 Methods Discussed in (i) Above (Their Relative Strengths and Weaknesses)
The main strength of the DCF (firm valuation) is that it uses expected future cash flows instead of historical data on cash flows. Analysts hold the perception that historical data only provide information about the past when investors are concerned about the future performance of the firm (Panigrahi et al., 2014). It is better to use cash flows because they present a firm’s ability to generate returns.
The DCF (firm valuation) model uses on a single year to make forecasts of cash flows. Cheng (2005) suggests that it is inadequate to base an analysis on a single year for stock valuation. The DCF uses an assumption that growth will be constant as projected.
Apple’s performance and the business cycle are unpredictable because it does not follow economic cycles. Apple’s financial statements also indicate that the cash flows can vary widely between two years (Apple, Inc., 2012).
The main strength of the DDM (equity valuation) is that it is based on cash flows to the shareholder. The investor can relate his expected earnings to real cash flows in the form of dividends.
The DDM (equity valuation) fails to capture movements in the market prices. Lee (2005) discusses that the volatility of stock price variations is likely to be higher than explanations derived from the DDM. Jiang & Lee (2005) explain that the DDM cannot be applied in firms that are starting business and high-growth firms, which do not pay dividends for a particular period.
The DDM model can only be used accurately for a firm that regularly pays dividends. As it was noted during the financial crisis, even firms with weak financial positions were paying dividends to make their stock prices appear attractive.
Agreement or Disagreement with the Theoretical
I agree with the DCF (firm valuation) model more than the DDM (equity valuation) model. Brigham and Ehrhardt (2013) discuss that free cash flow matters the most in maximizing shareholder value. I do not agree with the DDM model mainly because it varies greatly for small changes in the retention rate. I tried to use distributed dividends to calculate the retention rate, which was about 70%.
The result is that the intrinsic value rose above $1000. It became reasonable to use the dividends per share and the number of shares to arrive at a moderate retention rate value. It also shows that a firm that has not paid any dividends will appear to have an extremely high growth rate and intrinsic value because the retention rate will be 100%.
Present an Evaluation of the Current Performance of Your Chosen Company Using ROCE, RI, EVA, and SVA
Calculations
All values are in $ millions
Sources: Apple, Inc. (2013) and Apple, Inc. (2012).
(See Table 1 for tables)
Table 1. ROCE Calculations
Financial Statements
Positive ROCE indicates that the firm has been able to exceed investor-required rate of return and cost of capital.
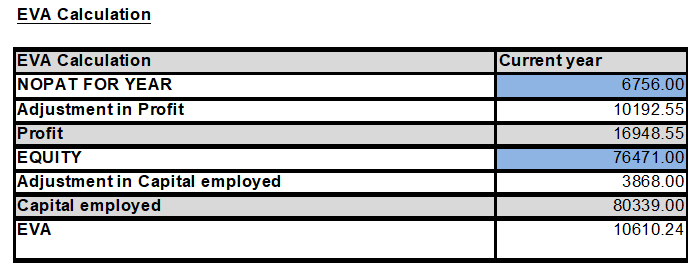
Positive EVA is an indication of economic profit and higher returns than alternative investments (Sharma & Kumar, 2010).

(See Table 2 for tables)
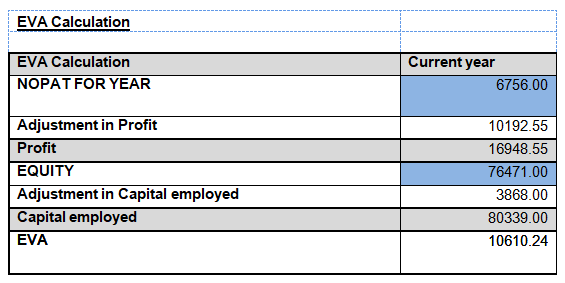
Table 2. EVA
RI also estimates economic profits.
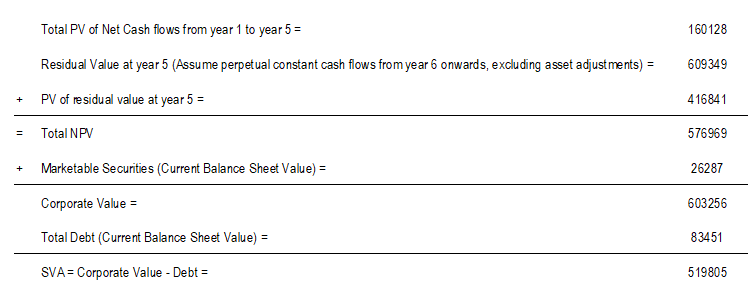
(See below for tables)
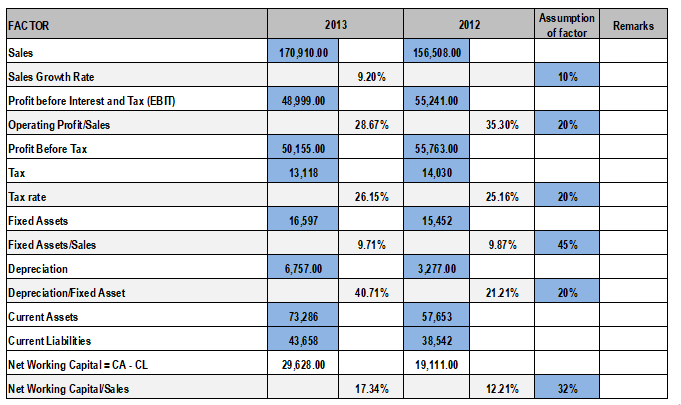
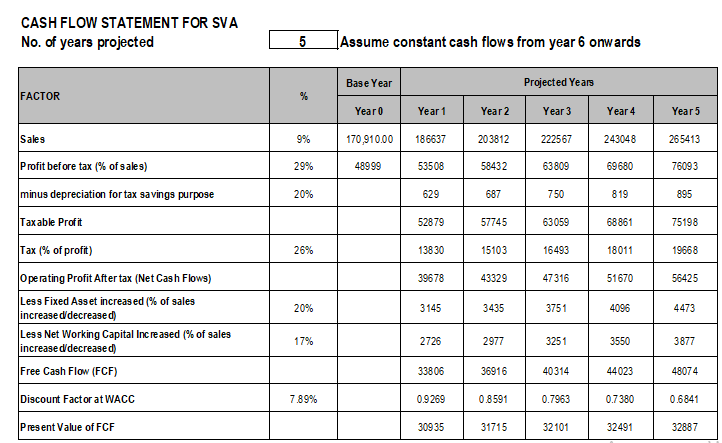
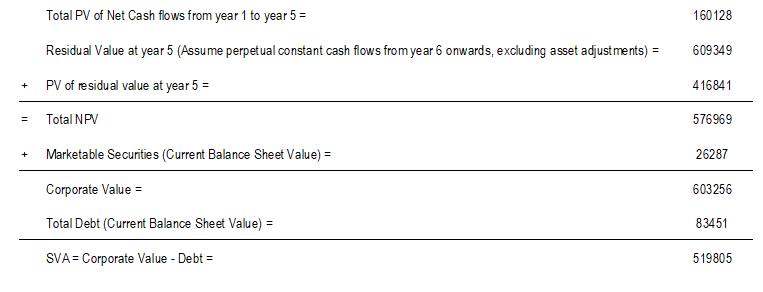
Assumptions You Have Made for the Calculations in Part (I) Above.
The factors used in calculating SVA are estimates of factors found above. A greater challenge was met in calculating EVA because some of the items required for the calculations were not presented in the financial statements.
Critical Evaluation of the Usefulness of ROCE, EVA and SVA
Value Drivers
Minchington & Francis (2000) explains that it is common practice to enlist the value drivers and integrate them into a single formula for calculating value to shareholders. Sales growth has been incorporated by estimating the change between 2012 and 2013.
The possibility of launching new products successfully is the major driver of growth in Apple’s performance. In the calculations, most of the models start with incorporating the operating profit.
Comments on the Three Measures
The common feature of the three measures is that they rely on accounting figures for calculations. Jones & Randolph (2005) claim that accounting figures can be manipulated such that they fail to provide investors with the actual financial position.
The three measures are reliable provided that the financial statements give a true picture of the firm’s operations. Minchington & Francis (2000) suggest the use of accountants to make adjustments to capital employed and operating profit value to reflect economic values.
SVA is a better because it uses expectations for future cash flow. Panigrahi et al. (2014) discuss that investors are more concerned about a firm’s ability to generate cash flows. A major strength of SVA is its use of expected future cash flow instead of historical cash flows. Analysts suggest that historical data will have less influence of a firm’s ability to generate cash in the future.
However, there are enforceable contracts and goodwill that may affect a firm’s ability to generate cash. A major weakness of the SVA approach is that estimates are likely to be different from the actual cash flow values. Another weakness is that the business environment may change in the five-year period. Cheng (2005) states that evaluating only a single year prior to forecasting is insufficient for valuation purposes.
Another common feature between ROCE and EVA is that they tend to estimate economic profits. Jones & Randolph (2005) describe EVA as providing an estimate of profits generated after all capital costs have been deducted. Shoesmith (2004) explains that ROCE is the value from which equity and borrowing costs have been deducted. Ray (2012) describes EVA as “an estimate of a firm’s economic profit” (p. 260).
A company with a high ROCE, such as Apple, has a higher probability of remaining profitable in difficult economic conditions. Pattabiraman (2013) explains that firms that have a higher ROCE will have higher stock returns than low-ROCE firms despite high inflation rates and interest rates.
Firms with lower ROCE are likely to generate negative economic profit in such conditions. Pattabiraman (2013) discusses that firms with a high ROCE have the required margin of safety before operations become unviable.
ROCE may be influenced by the type of industry in which a firm operates. Pattabiraman (2013) explains that ROCE has attributes of the firm and the industry. There are industries that have higher ROCE than others.
Porter (2008) enlists that software packages and related industries had the second highest return on invested capital among companies that operated in the U.S. between 1992 and 2006. Airlines had the lowest return on invested capital during the same period. Apple is within an industry that generates high ROCE.
ROCE is because it examines whether a firm is generating higher returns that the cost of financing the investment with both equity and debt (Shoesmith, 2004). ROCE differs from ROE by incorporating the cost of debt into the calculations.
In that case, a positive ROCE provides the returns above the shareholders’ required rate of return. Sharma & Kumar (2010) discuss that traditional performance measures, such as EPS and ROI, fail to consider the full cost of capital.
Dash et al. (2013) suggest that the value of human capital should be incorporated in the calculation of EVA. Dash et al. (2013) describe human capital as an “organization’s combined ability to solve problems” (p. 100). Firms in the consumer electronics sector strongly rely on the performance of their R&D departments. In return, R&D depends on the accumulation of technical knowledge.
Dash et al. (2013) suggest the use of productivity (measured by operating profit) and cost of labor in calculating WACC. Inclusion of human capital in the calculation of WACC increases the discount rate. The firm will need higher ROCE to cover accumulation of human capital.
EVA encourages managers to use cash in activities that are likely to generate economic profits. Jones & Randolph (2005) discuss that managers will have to consider capital costs and operating costs when selecting activities and assets.
Ray (2012) discusses that EVA encourages managers to utilize funds efficiently. It makes firms to seek optimal capital structure by minimizing cost of capital and maximizing returns (Lin & Zhilin, 2008). Ray (2012) explains that it motivates managers to align their interests along those of shareholders. Sharma & Kumar (2010) explain that it helps to reduce the agency conflict.
EVA is used as a short-term assessment tool. Ray (2012) suggests that the components of EVA are difficult to incorporate into a firm’s implementation program. EVA may not be attractive to use for a firm that has invested heavily currently and anticipates generation of returns in the long-term.
Conclusion
Apple’s lifecycle can be described as dynamic because it can change at any time provided that the firm is successful with its R&D developments. The firm operates in a high ROCE industry. Firms are able to generate profit by using differentiated products and price skimming.
Apple’s performance is cyclical in nature. Currently, it is on a downward trend. The ROCE, EVA and RI are measures that try to indicate economic profits generated by the firm. Apple has positive values in all the measures. It shows that the firm has the required margin of safety for an investor.
References
Ali-Yrkko, J., Rouvinen, P., & Seppala, T. (2011). Who captures value in global supply chains? Case Nokia N95 Smartphone. Journal of Industry Competition and Trade, 11(3), 263-278. Web.
Apple, Inc., Investor Relations. Web.
Apple Inc. (AAPL). (2014). Web.
Board of Governors of the Federal Reserve System (2014). Selected interest rates (daily) H.15. Web.
Brigham, E., & Ehrhardt, M. (2013). Financial management: theory and practice (14th ed.). Mason, OH: South-Western Cengage Learning.
Cheng, Q. (2005). What determines residual income? The Accounting Review, 80(1), 85-112. Web.
Damodaran, A. (2012). Investment valuation: tools and techniques for determining the value of any asset (3rd ed.). Hoboken, NJ: John Wiley & Sons.
Dash, S., Agrawal, V., & Sinha, A. (2013). Impact of human capital incorporation on economic value added of large scale organizations: A conceptual managerial decision making approach. European Journal of Business and Management, 5(32), 98-105. Web.
Gereffi, G. (2014). A global value chain perspective on industrial policy and development in emerging markets. The Duke Journal of Comparative and International Law, 24(11), 433-459. Web.
Holcombe, R. (2009). Product differentiation and economic progress. The Quarterly Journal of Austrian Economics, 12(1), 17-35. Web.
Hunt, S. (2011). The theory of monopolistic competition, marketing’s intellectual history, and the product differentiation versus market segmentation controversy. Journal of Macromarketing, 31(1), 73-84. Web.
Jiang, X., & Lee, B. (2005). An empirical test of the accounting-based Residual Income Model and the traditional Dividend Discount Model. The Journal of Business, 78(4), 75-101. Web.
Jones, W., & Randolph, G. (2005). An examination of the consistency of risk differentials between historical measures of risk and the risk implied by economic value added. Journal of Business and Economics Research, 3(12), 25-31. Web.
Levie, J., & Lichtenstein, B. (2008). From “stages” of business growth to a dynamic state model of entrepreneurial growth and change. Hunter Center for Entrepreneurship University of Strathclyde Working Papers, WP08-02, 1-68. Web.
Lin, C., & Zhilin, Q. (2008). What influences the company’s economic value added? Empirical evidence from China’s securities market. Management Science and Engineering, 29(1), 66-77. Web.
Minchington, C., & Francis, G. (2000). Shareholder value. Management Quarterly. Web.
Moles, P., Parrino, R., & Kidwell, D. (2011). Fundamentals of corporate finance. Hoboken, NJ: John Wiley and Sons.
Panigrahi, S., Zainuddin, Y., & Azizan, N. (2014). Linkage of management decision to shareholder’s value: EVA concept. International Journal of Finance and Banking Studies, 3(1), 114-125. Web.
Parrilli, M., Nadvi, K., & Yeung, H. (2014). Local and regional development in global value chains, productions networks and innovation networks: A comparative review and the challenges for future research. European Planning Studies, 21(7), 967-988. Web.
Pattabiraman, S. (2013). Growth vs profitability: The importance of ROCE. CFO CONNECT. Web.
Porter, M. (2008). The five competitive forces that shape strategy. Harvard Business Review. Web.
Ray, S. (2012). Efficacy of economic value added concept in business performance measurement. Advances in Information Technology and Management, 2(2), 260- 267. Web.
Sharma, A., & Kumar, S. (2010). Economic value added – literature review and relevant issues. International Journal of Economics and Finance, 2(2), 200-221. Web.
Shoesmith, J. (2004). Return on capital employed and return on equity. The Serious Investor. Web.