Introduction
The Canadian and the Australian economies are similar and different in equal measures. Both economies are small with similar economic structures and statistical systems. Population wise, both countries fall within similar ranges, Australia’s population is 20 million while Canada’s population is approximately 30 million.
Consequently, the GDP of both countries fall within similar ranges, in 2001, the GDP per capita of Canada in terms of purchasing power parity was approximately USD 28,900 where as that of Australia was USD27, 300 which is an indication that both countries fall within similar levels in their standard of living (Harchaoui, Jean and Tarkhani, 2003, p. 1).
These are the aspects that make the comparing and contrasting of these countries a meaningful and interesting task.
The various aspects to be compared are their levels of prosperity, what drives their labor productivities and growth and industry productivity, standard of living, monetary effects, terms of trade, employment rates, commodity prices and capital investment flows. The economies of Canada and Australia are considered to be miracle economies.
The economic structures of both Canada and Australia are similar. They both import production technology, machinery and transportation equipment; these represents almost half of all the net imports of the two countries and it is mainly imported from the USA. Consequently, both Australia and Canada have a lot of natural resources which dominate the primary economic structure.
This is reflected in their exports where 55 percent of Australian exports are in form of raw materials as compared to 46 percent for Canada. Consequently, cross country economic comparison is based on productivity performance. The productivity of both countries is integrated on their national accounts system (Harchaoui, Jean and Tarkhani, 2005, p. 36).
Also to be evaluated in this essay is the link between Australia and Britain and that of Canada and USA. The historical tie that exists in the links is an indication of complexity in economic development patterns which can not be predicted or defined by any model. The difference in the economic development between the two countries is as a result of their orientation and expansion in export trade.
The export versus the GDP ratio of the two countries exhibits some diversity. Majority of Australia’s and Canada’s exports are destined for Britain and the USA markets but in the recent times, the USA has overtaken Britain as the main market destination for Australian goods (Goodman, 2009, p. 62).
Economic Characteristics of the Two Countries
GDP per Capita
The GDP of the two countries when compared according to the purchasing power parity of the population is relatively the similar; Canada’s statistics stood at USD39, 900 while that of Australia was USD37, 300 in the year 2008 but the growth in GDP of Australia has been progressing at a higher rate than that of Canada (Stevens, 2009, p. 35). These GDPs is derived from two sources namely labor productivity and labor utilization.
This gap in purchasing power parity of the people is caused by the difference in the labor market and labor productivity (Harchaoui, Jean and Tarkhani, 2003, p. 6). For the last two decades the GDP of Australia has grown at a faster rate than that of Canada. The table below illustrates the growth rate in per capita GDP. This is an indication that both countries have similar nominal GDP as well as the same range of actual GDP.

From the GDP figures presented in the data description above, in the five year period from 1996 to 2001, the rate of growth for Australia’s GDP in per capita grew at an average of 2.7 percent per year while that of Canada grew at 2.8 percent per year but comparatively in general the real GDP of Australia grew at 3.9 percent while that of Canada grew at 3.8 percent.
Economic Structure
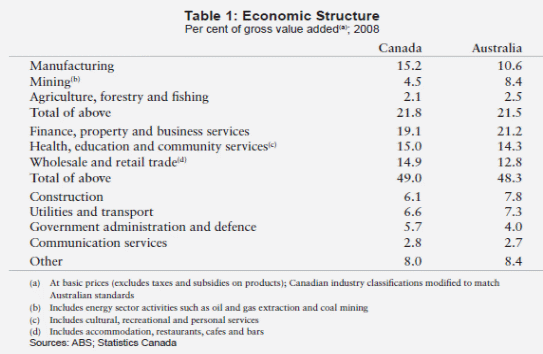
Regarding the economic structure of the two countries, both of them have similar primary production sectors and of the same size. Australia has less of manufacturing activities but it has more mining than Canada. The two countries have similar economic structure particularly their natural resources endowment. There are minimal notable differences in the mineral sectors in the two countries.
The natural resources in the two countries play a major economic role. The economic structures of the two countries are generally similar beyond the resource sector concentration which is not common among developed countries.
Trade and Financial Flows
The level of trade and financial flows between the two countries are relatively small, in this aspect Canada accounts for approximately 1 percent of Australia’s exports and imports and close to 1 percent of foreign investment was received by Australia. Overall trade is in favor of Australia but it is important to the two countries.
Export accounts for almost a quarter of Australia’s GDP but accounted for a third of Canada’s GDP in 2008. Commodities occupy significant percentage of exports in the two countries. Export trade is more important to Australia since they export small quantities of machinery, equipment and cars.
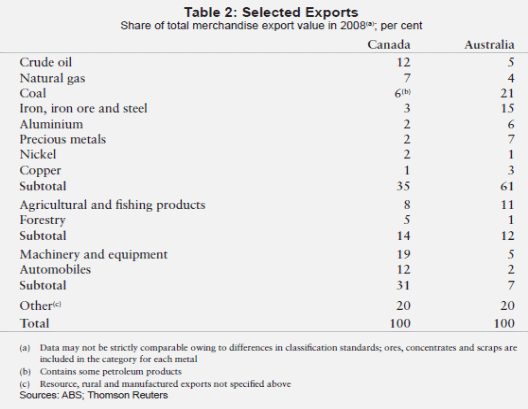
Consequently, the commodity exports of the two countries differ; Canada’s exports include crude oil, natural gas and forestry products while Australia’s exports are coal, iron ore and metals.
Terms of Trade
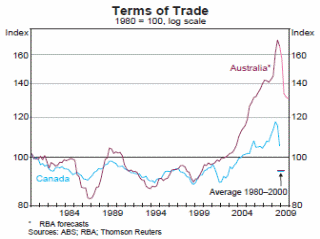
Due to the global upswing, the two countries have seen their terms of trade increase but Australia’s terms of trade has been ahead of Canada’s. From 2002, the Canadian terms of trade has been increasing by a margin of 30 percent while that of Australia has been rising by over 60 percent.
This difference is due to the fact that Australia has a larger share of commodities and it is therefore favored by the principle that the higher weighting in commodities experience, the greater the price increase and since Canada’s trade share of the economy is larger than that of Australia, it experiences small share of terms of trade increase which is still enough to boost national income.
Exchange Rates and Inflation
There are also differences in the two countries on the aspect of interest and exchange rates. These variables have a great influence on economic inflation. Australian dollar has not raised as much as the Canadian dollar; this has surprised economic commentators since the dollar factor does not reflect Australia’s increasing terms of trade.
Australia has witnessed a rise in demand on average during the period 2002 to 2008 when compared to Canada. This rising on demand was characterized by rising inflation at the end of the global upswing; this deviated further than Canada’s. This is an indication that Australia coped with the favorable terms of trade better.
The improvement of inflation in Australia is due to various economic reforms that were implemented like the floating of exchange rate, the advocating for a more flexible labor market and the stronger monetary framework. The recent global financial crisis experienced in 2008 reversed the economic direction of both countries due to the global recession.
It was expected that Canada would have sensed the global recession due to its strong trading ties with the USA which absorbs close to three quarters of its exports which is equal to a quarter of its GDP. The global recession which began in the housing sector led to the reduction in the demand for Canadian exports and hence lowering its terms of trade.
In the context of Australia, the global recession did not impact that much on the economy due to the diverse nature of the destination of its exports and it is particularly oriented towards Asia where their largest market is china, Korea and Japan which relatively remained largely unaffected by the global financial crisis hence Australia’s export market was not affected.
Inflation between the two countries has fallen and moderated at the same time, this is largely due to the fall in the prices of petrol and the rate of inflation is higher in Australia than Canada (Stevens, 2009, p. 41).
Overall investment differentiates Canada and Australia. This is largely linked to the disparities in human capital formation. The availability of all factors of production in the two countries i.e. labor, land and capital shows that there are few differences between the two countries (Greasley and Oxley, 1998, p. 296).
Banking Sector
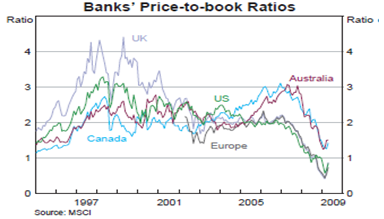
The two countries share a relative resilience in the banking sector. They have profitable banks which still withstood the global financial crisis. The return of equity for example in the largest Australian banks is 17 percent while in Canada it is 14.5 percent and they are considered exceptional in profitability all over the world.
Consequently, the equity market valuations of the banking system in the two countries display more confidence asset quality and future earnings as compared to the other developed countries like the US as indicated by the graph in the data section of this essay.
The excellent performance of the banks is due to various factors like holding of complex securities during the time of crisis which matches international standards, another factor is their conservative lending rates in home markets unlike in other countries like the USA and UK. Consequently, their mortgage market accounts for just less that five percent unlike the thirteen percent in the USA.
The two countries have also witnessed a boom in the housing market which is linked to their strong commodity prices and a shift in their productive resources to the industries and the regions that enjoy boom (Stevens, 2009, p. 41).
Regarding to their currencies, the Canadian dollar is expected to outweigh the Australian dollar as the best performing currency of exchange immediately the economy of the US recovers.
The two currencies are expected to gain value due to the acceleration of global economy but the Aussie dollar will likely grow at a slower rate due to the China- Aussie link factor which leaves limited room for the imprecation of Australian dollar against the US dollar.
With the improved links and geographical ties between US and Canada, an improvement in the US economy can trigger the appreciation of Canadian dollar to outshine other commodity currencies. This will make the Canadian dollar outshine the Australian dollar. Consequently, the developments in the commodity market will work to the benefit of the Canadian dollar.
This is largely due to the strong links of Canadian dollar with oil unlike the Aussie which is linked with gold and other metals.
The economics behind this currency phenomenon is that the tight monetary policies of the US will undermine the prices of gold which will work against the Aussie dollar while the unrest in the Middle East and Maghreb region will keep the prices of oil and gas high (Mortimer, 2011, p. 1).
Trade Relations
Concerning the trade relationships between the two countries, Canada has a very strong trading relationship with dominant economic powers like the US, Mexico and the UK. Australia on the other hand has strong trading ties with China which is its largest import partner and it dominates approximately 22 percent of Australia’s exports.
Australia also maintains strong trading ties with the booming Asian market like India which will be in dire demand need of raw materials for their expanding economy. In this scenario, if one of the trading partners pulls out of the trade relationships, the two countries Canada and Australia can still recover a stable trading partner due to its lucrative and on high demand natural resource and raw materials.
This can be the main reason why the two countries survived the global recession and both now enjoy a strong domestic consumer presence.
Unemployment
Unemployment rate in Canada fell to a low of 8.4 percent in 2011 from a previous 8.7 percent, consequently, the economy created 31, 000 jobs due to the large employment growth. During the year 2011, the unemployment rate in Australia is expected to fall despite the constant labor market participation (US State Department 2011, p. 1).
Data Describing the Characteristics

Economic structure
The following table illustrates the description of the economic structure in the two countries expressed as percentage of gross value (Word Press, 2010, p. 1).
Trade and Financial Flows
The list of exports in the two countries is indicated below.
Terms of Trade
The graph indicating the terms of trade between the two countries is indicated below.
Commodity Prices
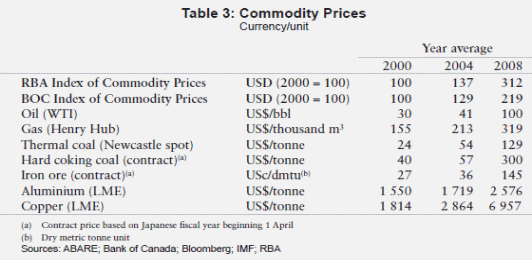
Commodity prices between the two countries also tend to vary and are largely influenced by the dynamics of the world business cycle; this means that commodity prices are prone to fluctuations. The table below illustrates the difference in commodity prices between the two countries.
The following graph indicates the consumer price inflation between the two countries. In recent times, Canada’s terms of trade are at average level while Australia’s producers of resources have accepted lower prices so as to ensure that the terms of terms decline.

(Stevens, 2009, p.40)
Banking Sector
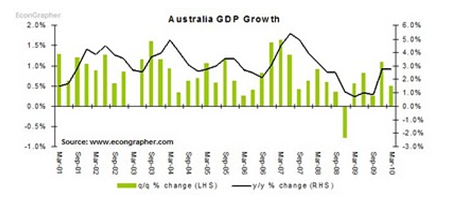
In the last two years, Australian economy has been growing at a rate of 2.7 per annum. This growth has been associated with its strong policy of capital formation and increase in the household consumption expenditure. The government policy of stimulus spending and the recovery of commodity prices have also played part in the economic growth. This is indicated and illustrate by the following graph.
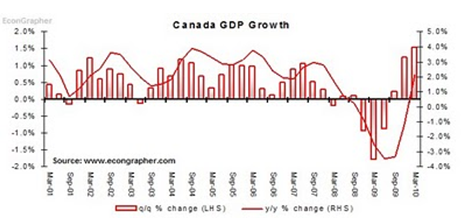
Consequently, the Canadian economy has been growing at a rate of 1.5 per quarter which is an indication of a growing economy. When compared to other developed countries, Canada’s economic growth is largely due to the increase in commodity prices which is a result of the appreciation of Canadian dollar and the recovery of US economy. The graph on the Canadian GDP is illustrated below.
Background of the Two Economies that Explains their Two Characteristics
The economy of Australia is dominated by the services sector and majorly agriculture and mining account for their exports. The power of export and the small domestic wealth where there is a population of only 23 million people against the land area nearly the size of the USA is what gives Australia its comparative advantage in the global economy.
Despite the decline of its manufacturing sector, it is still a major contributor to the GDP. The global recovery after the recession placed a high pressure on the Australian commodity exports hence leading to an increase in terms of trade. Australia enjoys the largest degree of standard of living due to its good macroeconomic policies.
Canadian economy is considered to be one of the most stable in the world. Its market oriented policies resembles that of the US. It has better standard of living and good pattern of production. The growth of the Canadian economy is largely due to the three booming sectors; manufacturing, mining and the services sector.
This was further enhanced following the signing of the US-Canada Free Trade Agreement in 1989 and the signing of the North America Free Trade Agreement (NAFTA) in the year 1994 which enhanced its trading relationships with the US which is considered to be its largest market. Canada enjoys a solid economic pace due to its abundant natural resources, skilled labor force and capital plant (Global Edge, 2011, p. 1).
Australia and Canada have diverse macroeconomic histories. The per capita GDP of Australia was way above that of UK and US by the year 1870 and it was twice the economic level of Canada. Consequently, by 1980, the economy of Canada was nearly matching that of US and slightly above that of Australia and UK.
The two countries are heavily reliant on international trade to expand their economies because both are major producers of commodities. This implies that they heavily rely on global capital markets. There are a lot of questions as to why the two countries have pursued different macroeconomic policies yet they are British dominions with similar history of colonial origins.
The differences and the similarities of the economy of two countries should also be investigated along the lines of their links with world powers, the link between Australia and UK and that of Canada with the USA and how it shaped their economic development. The convergence of their economies is drawn along the line of income levels between the two countries and their technological capability.
The two countries have several things in common ranging from their medium economies, to their similar colonial power and unique terrain. The two countries were in a better fiscal and economic position before the global meltdown and they had run into surpluses for several years. The two countries, after the economic recession bounced back due to the increased prices of metals, gas and oil (Braxland, 2006, p. 252).
Conclusion
The geographical location of Australia is the greatest asset to its economy. It benefits by having a close relations in trading with countries in Asia which accounts for close to 40 percent of its exports. With the economic crisis that crippled their Asian export market, Australia has at times found other new export market. Its weaker dollar when compared with the US dollar has aided the resilience of Australian economy.
Although statistics reveal that Australia performed better than Canada when compared in terms of productivity and overall economic growth, the pace of the growth of the standard of living is similar. It is primarily the source of productivity that differentiates the two countries.
Canada’s performance and real average growth is largely attributed to the growth of labor utilization. The difference in labor productivity between Canada and Australia is largely due to the improvements in efficiency which can lead to labor and capital transformation.
In terms of economic output, rates of employment and unemployment, Australia and Canada display some similarities. Whereas the economy of Australia performed well during the decade of 2001, it was only in the period 1991 and in 1996 that Australia’s economic growth was superior to that of Canada.
The stability of the banking sector in the two countries and the stability of the housing market have placed the countries in a better economic position than other developed countries in the world.
The main difference between the two countries is that the diversified nature of the Australian export has shielded it from the global recession or any financial crisis in some of its trading partners. This is as opposed to Canada’s exports which are destined for US as its main market which makes it vulnerable to global recession.
References
Braxland, J. 2006 Strategic cousins: Australian and Canadian expeditionary forces and the British and American empires, McGill-Queen’s Press, New York.
Global Edge 2011, Canada: Economy, Michigan State University. Web.
Goodman, B. 2009, Two dependent economies, Canadian Institute of International Affairs, Ontario.
Grapher, E 2010, Top 5 economic graphs for the week ended 6 June 2010, Daily Markets. Web.
Greasley, D. & Oxley, L. 2008, “A tale of two dominions: comparing the macroeconomic records of Australia and Canada since1870”, Economic History Review, vol. 1, no. 2, pp. 294-318.
Harchaoui, M., Jean, J. & Tarkhani, F. 2003, Prosperity and productivity: A Canada-Australia comparison, Government of Canada. Web.
Harchaoui, T., Jean, J. & Tarkhani, F. 2005, Comparisons of economic performance: Canada versus Australia, 1983–2000, Bureau of labor Statistics. Web.
Mortimer, J. 2011, Analysis: Canada dollar to outshine Aussie when U.S. turns, Reuters. Web.
Richardson, S. & Lester, L. 2004, A Comparison of Australian and Canadian Immigration Policies and Labor Market Outcomes, Immigration Policies. Web.
Stevens, G. 2009, Australia and Canada- comparing notes on recent experiences, Publications Bulletin. Web.
US State Department 2011, Background note: Australia, State Government. Web.
Word Press 2010, Canada vs. Australia similarities and differences, Beats and Pieces. Web.