Introduction
The article about competition in the wool industry indicates that the prices of wool were very low in Australia in the last ten years. Producers of wool made losses since the prices at which they sold their products were below their production costs. As a result, nearly half of the producers left the industry (ABC 2011, p. 1). However, the prices of wool increased significantly last year, thereby increasing revenues in the industry. As a result, more producers are joining the wool industry to benefit from the high prices.
This paper will analyze the wool market in Australia. Specifically, the analysis will focus on the influence of price changes on wool producers’ profits and output levels in the short-run and the long-run. The first part of the paper will focus on market structure analysis using the concept of demand and supply. The second part will focus on short-run and long-run equilibrium analysis of the wool market.
Market Structure
Price Determination
The wool market in Australia is perfectly competitive because it consists of a large number of sellers and buyers (AWEX 2009). The buyers have adequate knowledge of the prices charged by various producers of wool. This means that buyers are likely to purchase wool from producers who charge the lowest price. Similarly, the producers have adequate knowledge of the prices offered by the buyers (AWEX 2009). Thus, they are likely to sell to buyers who offer high prices in order to increase their profits. This means that the equilibrium price at which wool is sold and bought is determined by the forces of demand and supply as shown in figure 1.

Figure 1 represents the initial state of the market (1988-1989) when wool prices were favorable. In panel A of figure 1, D and S denote demand and supply curves respectively. P and Q denote price and quantity of wool respectively. The market for wool is in equilibrium at point E. Thus, the equilibrium price and quantity are P0 and Q0 respectively. Any producer whose price is above P0 will lose his or her customers to the competitors (Schotter 2008, p. 61). Thus, panel B of figure 1 shows that wool producers have a straight demand curve.
Price Reduction
The significant reduction in the prices of wool that occurred after 1989 is likely to have been caused by a fall in demand. People are being “attracted back to wool, both producers and consumers” (ABC 2011, p. 1). This statement indicates that consumers had reduced their expenditure on wool after 1989. One of the factors that are likely to have caused the reduction in expenditure is a change in testes and preferences (Swan 2013, pp. 1-21).
Specifically, consumers are likely to have opted to purchase clothes that were made of other materials such cotton and jeans. The reduction of the prices of the substitutes of wool is also likely to have caused the decrease in demand (Swan 2013, pp. 1-21). Technological advancements led to production of synthetic fabrics that were cheaper than wool. The resulting decrease in the price of clothes that were made using synthetic fabrics is likely to have reduced the demand for wool.
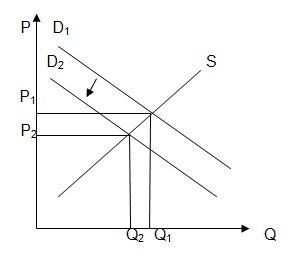
In figure 2, the reduction of the demand for wool is illustrated by the downward shift of the demand curve from D1 to D2. This shift caused the quantity of wool demand to reduce from Q1 to Q2. Similarly, the price of wool declined from P1 to P2. Although the decrease in price is likely to have benefitted consumers, its effect on wool producers was negative. Since the market is perfectly competitive, wool producers had to accept a lower price (P2) in order to sell all their output. Similarly, they had to reduce their output due to the decrease in the quantity of wool demanded by consumers. Undoubtedly, a reduction in price and sales leads to losses (Taylor & Weerapana 2011, p. 83).
The Effect of Price Reduction
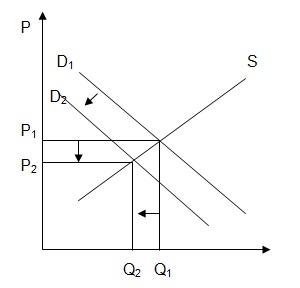
The effect of price reduction on producers is illustrated in figure 3. The figure shows that producers of wool responded by reducing their supply. Specifically, the reduction in price from P1 to P2 led to a decrease in the supply of wool from Q1 to Q2. The reduction in supply represents the wool producers who left the industry after the price reduction.
Effect of Price Increase
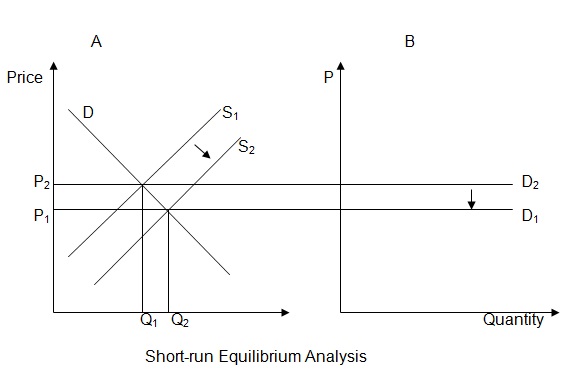
The prices of wool “will stay relatively high for the next five years” (ABC 2011, p. 1). The price increase will improve earnings in the industry. As a result, more producers will continue to enter the industry in the next five years in order to earn high profits (Cowen 2011, p. 91). The rise in the number of producers will lead to an increase in the quantity of wool supplied as shown in panel A of figure 4.
The increase is illustrated by the shift in the supply curve to the right from S1 to S2. Eventually, the demand for each producer will reduce as shown in panel B of figure 4. The decrease is shown by the downward shift of the demand curve from D2 to D1. Similarly, the price at which producers will sell their products will reduce from P2 to P1. This means that the price of wool is likely to decline after five years if the demand fails to match the expected increase in supply (Cowen 2011, p. 93).
During the Low Price
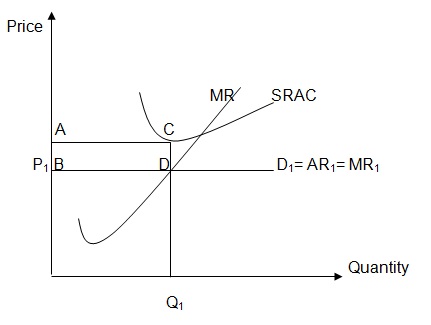
In the last ten years, the prices of wool “have been below the cost of production” (ABC 2011, p. 1). This means that producers of wool have been making loses. The losses are attributed to the fact that the average cost of producing a kilogram of wool was higher than the average revenue received by selling a kilogram of wool. The short-run equilibrium of the market is illustrated in figure 5.
In figure 5, MR denotes marginal revenue, SRAC denotes short run average cost, D denotes demand, and AR denotes average revenue. Point D is the short-run equilibrium. P1 and Q1 are the equilibrium price and quantity of wool respectively. For a firm to breakeven, it must produce at a level where its marginal revenue is equivalent to its marginal cost (Schotter 2008, p. 112). This condition cannot be achieved by selling Q1 kilograms of wool at a price of P1. At this level of production, the average revenue is less than the average cost of producing wool. In figure 5, the distance between point C and D indicates the loss that producers made per kilogram of wool. The area ACBD represents the total loss that producers made by selling wool at the low price of P1.
Firms have different abilities to absorb losses in the short-run and the long-run. In the short-run, most wool producers are likely to have stayed in the industry in anticipation of price improvements. However, the persistence of low prices for ten years is likely to have made production to be unsustainable in the industry by increasing losses. This explains the decision taken by nearly half of producers to leave the industry.
During the High Price
The short-run equilibrium of the industry changed after the increase in the price of wool. The change in the equilibrium is illustrated in figure 6. The equilibrium price at which producers sold their wool is P2. At this price, the producers were able to supply Q2 kilograms of wool. At the equilibrium point A, the average revenue is greater than the average cost of producing wool. This means that producers were making profits by selling their wool at a price of P2. The distance between point A and B in figure 6 indicates the profit that producers made per kilogram of wool. The total profit made by selling Q2 kilograms of wool is equivalent to the area ABCD in figure 6.
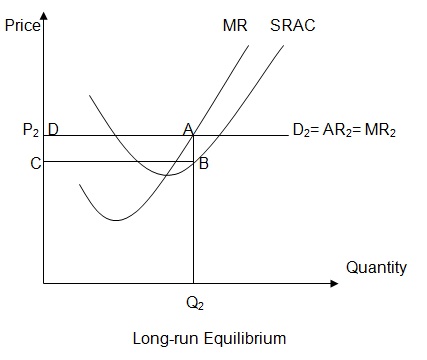
Long-run Equilibrium
In a market economy such as Australia, profit is an important determinant of resource allocation. Specifically, profit is a signal that enables entrepreneurs to identify the best investment opportunities or industries that are characterized by high returns (Taylor & Weerapana 2011, p. 117). Generally, producers invest in industries where profits are growing rapidly.
One of the main factors that enabled more farmers to join the wool industry after the price increase is lack of barriers to entry. The Australian wool industry is highly fragmented. It is characterized by thousands of small scale wool producers who have low market power (AWEX 2013). The producers have low economies of scale and their control over the distribution system is limited. Thus, the low market power of the incumbents was an opportunity to new entrants to join the industry.
As illustrated in figure 4, the increase in the number of producers in the industry will have a negative effect on prices in the long-run. The decrease in price will reduce the profit margins in future. Thus, total profits will reduce if sales fail to increase as shown in figure 7.

In figure 7, P3 is the long-run equilibrium price at which wool will be sold. Q3 is the equilibrium quantity of wool that will be sold in the long-run. Point G indicates the long-run equilibrium of the wool market. At point G, the average revenue will be equal to the average cost of producing wool. This means that producers of wool will be making normal profits. The long-run profits will be less than the super-profits (area ABCD in figure 6) that producers made in the short-run. The reduction in profits will discourage more producers from joining the industry in the long-run (Schotter 2008, p. 117).
However, the normal profits are expected to be adequate to enable wool producers to remain in the industry. Thus, in the long-run the size of the wool industry will remain stable until the equilibrium is destabilized. For instance, a significant increase in the population might raise the demand for clothes that are made of wool. The increase in demand will destabilize the long-run equilibrium by increasing the price of wool. As a result, the size of the industry will increase as more producers join it to earn high profits.
Conclusion
The effects of price changes on wool producers’ profits and output levels have been analyzed in this paper. The analyses show that price reduction led to a significant decline in the quantity of wool that was produced in Australia after 1989. The price reduction also reduced the profits of wool producers. As a result, most producers left the industry. The recent increase in the price of wool has motivated more producers to join the industry.
The short-run equilibrium analysis indicates that producers will make supernormal profits in the short-run. However, the producers will make normal profits in the long-run. The expected increase in output will reduce wool prices in the long-run, which in turn will cause profits to reduce to the normal level. In the long-run, the incumbent firms will have no incentive to leave the industry. Similarly, new entrants will have no incentive to join the industry. Hence, the size of the industry is expected to remain stable in the long-run.
References
ABC 2011, ‘Perfect competition in wool: finally superfine wool pays’, p. 1, 2014, via ABC Rural database.
AWEX 2013, The Australian wool market: an introduction for prospective participants, Web.
Cowen, T 2011, Modern principles of economics, Palgrave, London.
Schotter, A 2008, Microeconomics, John Wiley and Sons, New York.
Swan, P 2013, Australia’s wool in a competitive fiber market, Australian Wool Innovation, Sydney.
Taylor, J & Weerapana, A 2011, Principles of Economics, McGraw-Hill, New York.