Introduction
In the face of growing industrialization and modernization of life styles along with the changing consumer demand trends, one would be interested to observe the automobile market which may give us an idea regarding the changing tastes in luxury goods. Car off course is not a luxury for everyone, for some it is also a necessity. Small cars are usually fuel-efficient and serve the utility purpose well it seems. This paper shall compare three of the largest global automobile companies, Ford Motors, Toyota and general Motors with respect to their products and market apart form the financial results of the last five years. The idea is to find the relative position of Ford with the other two companies.
Ford Motors: brief history
Modern days’ industrialization owes to a great extent to the Henry Ford’s assembly line production methods, which were popularized as Fordism during early 1900s. Fordism showed us how to manage industrial workforce and production on a big scale. Ford Motor Company, founded by the father of assembly line production and hence industrialization in 1903 is a multinational corporation headquartered at America. Based on worldwide sales of automobiles, Ford Motor ranks fourth as automobile manufacturer after General Motors, Toyota and Volkswagen and ranks seventh in the Fortune 500 list with a global revenue of $172.5 billion in 2007, over 24500 employees, 6.553 million automobiles and 100 plants scattered around the world. The cars are sold under the brands of Lincoln, Mercury, Volvo, Mazda apart from the core brand Ford. The other two UK brands Jaguar and Land Rover were sold to Tata Motors. Ford has redesigned their car Focus that is still capturing a considerable part of the market. With strong sales figures, lucrative revenues and fuel economic technology the car sales went up by 91 percent in Texas and 46 percent worldwide. According to the vice president in Marketing and Communications of Ford Group, Jim Farley, “Focus continues to surprise and delight customers throughout the country, but the bombshell is in Texas, where Focus retail sales have almost doubled”. The sales of Ford, Lincoln and Mercury together have grown by 8 percent compared to the previous year. However Ford Escape, Edge and Flex has shown a fall by 8 percent while the utility vehicles like Ford Explorer and Expedition have shown a fall in sales of 54 percent. However this trend is considered to be in tune with that of the industry in the segment of crossover vehicles. Farley comments, “We expect the second half of 2008 will be more challenging than the first half as economic and credit conditions weaken”. (Ford Focus Continues to Surprise, Outpace Segment).
Financial Overview
Sales and income record
The net income and Sales figures show that the company grew between 2002 to 2004 then it fell from 2005 to 2006 and grew in the year 2007. However the company is making most times except in 2003, 2004 and 2005 losses. From 2002 to 2005 the loss position was declining gradually as the company was keeping a smaller part of the sales as profits. Here it shows that the company is sacrificing more than its sales revenue in the last two years.
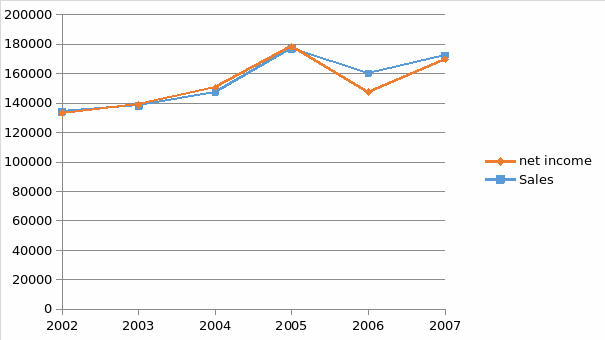
The graph shows that the trend sales takes, is followed by the trend of net income. There is growth in both sales and net income up to the year 2005 then it goes down in the year 2006 before an upward surge in the year 2007. This means that the company is performing very poorly in the year 2006. The management needs to investigate what ttok place that led to the decline of profit and sales.
Expenses distribution
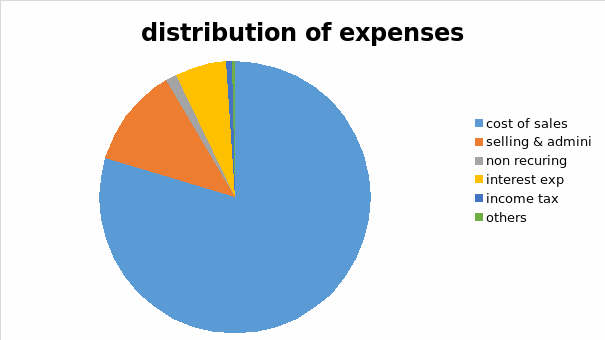
Cost of sales 142,587,000
Selling general and administrative 21,169,000
Non recurring 2,400,000
Interest expenses 10,927,000
Income tax 1,294,000
From the distribution of expenses in the chart below, one realizes that the cost of revenue contained over 80% of the total expenses for the company while selling and distribution expenses has over 12% of the total revenue. Other expenses except interest which is not a direct interest to sales are minor.
Asset and capital structure
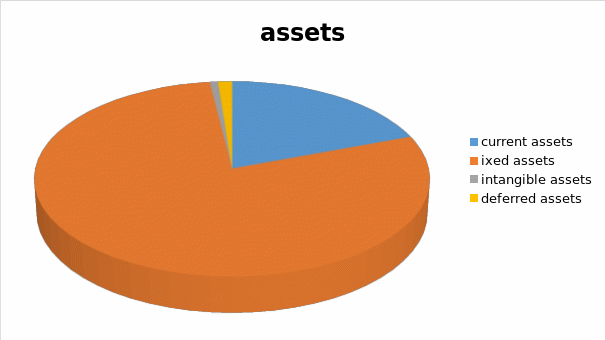
Fixed assets contain the largest share of expenses the company holds. it holds more than 79% of the total assets meaning that the company has invested heavily on the fixed assets. This may be due to the fact they are manufacturers of heavy and light machinery’s whose turnover is not as high as hamburger.

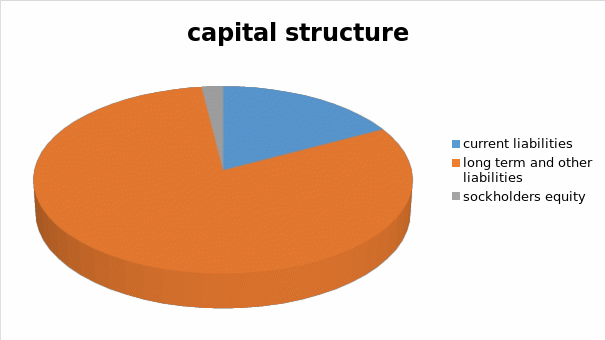
The companies capital structure as shown by the graph above shows that it is heavily indebted as credit facilities in terms of long term debts contains more than 80.6% of the capital used by the company. This kind of policy is very dangerous because this capital structure can ruin the companies’ future success.
Ratio Analysis
Liquidity
The liquidity position of the company has improved from year 2006 -2007 as it is shown by the current and quick ratios. The two ratios show how the company is able to meet current short term obligations. Always the ability of the firm to meet current obligations to creditors is normally gauged through the cash resources available and how it can generate cash through the operating cycle. Ford motor vehicles current ratio in the year 2006 is below the industrial average. However the current ratio in the year 2007 is greater than the industrial average. Although the difference is so small it shows that the creditors will be comfortable in dealing with other firms as compared to ford motor vehicle. in a nut shell the current ratio of ford motor vehicle is far below the industrial average, therefore it does not have enough liquid to meet obligations as per the industrial average.
Quick ratio of the company is 0.72:1 and 0.91:1. In the year 2006 the ratio is below the industrial average of 0.89:1 and in the year 2007 it is same as the industrial average. The quick ratio recognizes that the conversion of inventory is not quick therefore it is eliminated from the quick assts that is those assets that can be converted to cash quickly. As per the industrial average the company was great in danger of technical default which will lead to unnecessary legal tussles in court which may lead to liquidation of the company.
Asset management ratio
Fixed assets turn over for the company is far below the industrial average and it is 0.58 times and times 0.62 while the industrial average is 0.74 and 0.81 for years 2006 and 2007 respectively. It means that investment in assets is not being used to capacity as per the industrial standards. This ratio measures the overall investment efficiency of the form in both long term and short term assets. It means that the management is not utilizing the assets efficiently. Although the industrial average is also below 1:1 the ford corporation management seems to lack managerial ability to utilize the assets to capacity. They should improve the use of assets.
The average collection period for the firm is 16 days and 19 days for the year 2006 and 2007 respectively while the industrial average is 30days and 29 days for 2006 and 2007 respectively. This measures how effective the credit policy of the firm is. Again it shows how the investment in receivables is being maintained by customers. from the figures it is clear that the firms credit policy is far better than the industrial average, therefore they have a very good credit management industry as compared to other competitors in the industry.
Debt management
From the figures calculated above, it can be noted that in the year 2006 total liabilities were more than total assets. This means that the company was in the verge of collapsing and it was facing bankruptcy. However on the year 2007 the ratio has improved from times 1.01 to 0.98 meaning that some common stock equity was injected to the company or some of long term liabilities was redeemed. However in this case it seems some other stockholders equity which was a large negative was reduced. in such a situation a company is under bankruptcy.
Interests earned ratio shows how the ability of the profit of the company can be made recurring debt expense; unfortunately this ratio is far below the industrial average putting the company in financial crisis. The company cannot be able to meet the interest payments in the year 2006 since they are making lose. At the same time in the year 2007 they improve the situation since they are making some few profits.
Profitability ratio
All the profitability ratios show poor results overtime. In fact most of them show negative values for the years 2006 and 2007. As far as ROE is concerned the situation looks better from in 2006. However this is because of negative income and positive equity in 2007 unlike both the values being negative in 2006. So this is an illusionary impact again but the liquidity position shows remarkable improvement especially in terms of DSO and investment turnover. When compared with the other industrial average. The sales figures show a fluctuation especially the dip in 2006. The reason could be the launch of many new small cars including the hybrid cars of Ford in the market and the prices range offered by competitors which are even targeted for the middle class consumers.
Market values
The company market values are very low meaning it is performing below per in the market.
Conclusion and Recommendation
If we look at the values of these components for the company we shall be able to find the origin of the fall or rise in returns on equity. The fall in the value of ROE is due to the negative profits or the negative profit margin and the fluctuation in 2006 is owing to the sudden negative value of the equity multiplier. The asset turnover has shown some growth except a fall in 2006 followed by a steady recovery. Therefore the use of assets has not been inefficient and we may say that operating efficiency and financial leverage is responsible for this low return. Some components have been showing steady improvement and so are the values of ROE overtime. Therefore the position of the firm with respect to financial leverage, operating efficiency and asset utility has improved overtime.
Therefore the operating efficiency is low and declining and this is influencing the value of ROE. More or less we find that the operating efficiency is responsible for the fluctuations of returns, which shows steady progress. Therefore, improvements and innovations are sought on the technological side for Ford Motors in order to catch up with the competitors and the showing its versatility and ability to reach consumers at all levels. They should try grow its geographical and brands coverage, bring in an environment friendly technology or bringing in Green cars or cars run by alternate energy sources other than oil, research and development oriented towards environmental sustainability would be a profitable area to invest or and thus catch up with the challenges faced by the industry today.
References
Ford focus continues to surprise, outpace segment, (2008)Ford Motor corporation, 2008. Web.
“Ford Motor Company F”, Morning Star, 2008, Web.
Joel G. Siegel, Jae K. Shim, “Accounting Handbook”, SC Barron’s Educational Series, 2006, pp 45-88.
Lindsay R. (1967) Financial Management, an Analytical Approach; R.D Irwin.
Luecke R (2002) Finance for Managers; Harvard Business School.
Loren A. Nikolai, John D. Bazley, “Intermediate Accounting”, South-Western College Pub., 1999, pp 4-54.
Scalar, Elliott D. (2000). You Do not Always Get What You Pay For: The Economics of Privatization. Ithaca: Cornell University Press.
Tippett, M. (1990) “An Induced Theory of Financial Ratios”, Accounting and Business Research, Vol.21, No.81, Winter, pp.77-85.
White G.I., Sondhi A.C. and Fried D., (1997): l Analysis and Use of Finanacial Statements, Wiley, U.S.A.