Abstract
To show how static and dynamic balancing can be used to predict the location of imbalanced masses that are added to a system to counterbalance existing masses, an experiment called “Balancing of Rotating Masses” was conducted. The axial and angular locations were calculated using a sketching method (on graph paper). A shaft on which the masses are firmly linked and a DC motor to rotate the system made up the bulk of the balancing rig. The results showed that the system might be dynamically balanced by strategically placing two counter-weights (with different centers of gravity). It was also determined that imperfect dynamic balancing was not achieved because of human mistakes (such as parallax error), as the system still displayed some noise and vibration.
Introduction
When a body’s rotation does not generate any resulting centrifugal force or couple, we say it is dynamically balanced. No external force or coupling is required to rotate the system. When an object’s center of gravity lies along its axis of rotation, we say it is in a state of static balance (Noël et al., 2018). A system needs both static and dynamic balance for it to function correctly. To extend the useful life of components and lower failure rates, system balancing is crucial. It also helps lower unwanted noise and vibration. This experiment illustrated the necessity of dynamic balancing in real-world applications. Hence, this is achieved by creating a dynamic and static equilibrium of a multi-planar mass system.
Apparatus
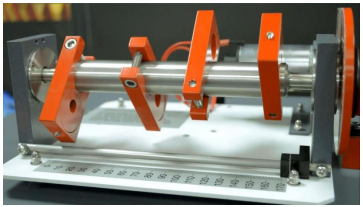
The central apparatus is used to take measurements from and to demonstrate dynamic balancing.
- Safety cover.
- Compass.
- Ruler.
- Protractor.
- Graph paper.
- Calculator.

Experimental Procedure
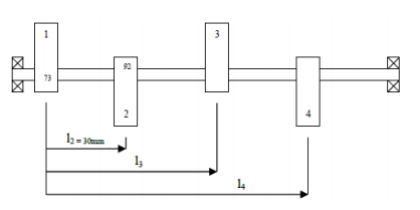
In the first step, the mr (mass times radius) values of all the “out of balance” masses in Table 1. (They are listed as mr 1=73 units, mr 2=92 units, mr 3=87 units, and Mr 4=65 units for this experiment). Then, the masses 1 and 2 must be fastened to their designated locations (m 1 at an axial distance of l 1 = 0mm and an angle of 0o, and m 2 at an axial distance of l 2 = 30mm and an angle of 200o).
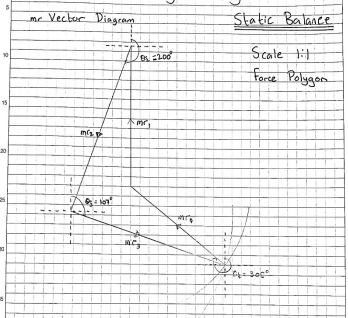
Third, to begin with, the structural and dynamic imbalance in the system, from the drive belt to the motor, should be removed. First, check static equilibrium by verifying that the system rests. Reconnect the belt and switch the motor to check the dynamic balance. Vibration suggests an uneven system. After that, plot (to scale) MR vector diagrams for all four variables. Sketch mr1 vertically, then mr2 at its angle. Using a compass, determine mr3 and mr4’s relative positions.
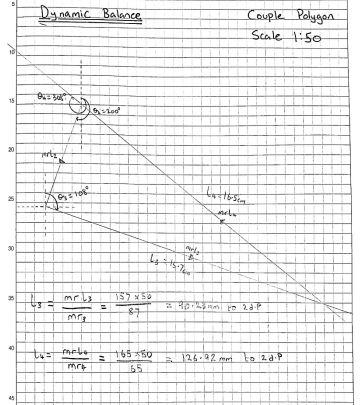
Take the angular distances between mr3 and mr4 with a protractor. Summarize Table 1 angles. Now, we need to plot (to scale) an mrl vector diagram with mrl2, mrl3, and mrl4. It is recommended that l be measured from a single reference point at Mr 1. Then, use this diagram to determine mrl 3, mrl 4, and the axial values of l 3 and l 4, as shown in figure 3 below. Further, secure m3 and m4 on the spinning shaft using the calculated angular and axial positions. Finally, turn on the motor to make sure everything is working correctly. In the absence of noticeable vibration, it can be assumed that the system’s dynamic balance has been restored.

Results
Table 1: tabulated results from the dynamic balance


Discussion
This laboratory study’s findings are consistent with the concept and theory of static and dynamic balance, as shown in Figure 4 above. Sketching the force and coupling polygons and then calculating the angular and axial coordinates of m3 and m4 presented no significant challenges. When physically applied on the balancing rig, the calculated ‘approximate’ values of angular and axial locations gave the impression of a relatively balanced system. There was still some background noise and vibration in the system, however. This means that while the written, graphical approach for generating these results was accurate, it lacked the precision of an analytical method. CAD might be used to sketch it graphically to reduce polygon drawing errors. The consistency of the experiment was hampered by human error, which occurred most often. Individual readings for angular and axial positions may not be correct due to a viewing angle that is not perpendicular to the object. The readings were all taken by one individual, so it is reasonable to assume they were systematic. Similar errors between readings may indicate accuracy.
Conclusion
The experiment proved the notion of dynamic balancing overall. However, this work shows that achieving a perfect balance is difficult unless the system is fully automated using precision equipment. The study’s findings provided concrete proof of the dynamic balancing principle. However, unless the system was automated with precise equipment, it is exceedingly unlikely to attain a perfect balance, as illustrated throughout this study.
References
Noël, B., van de Berg, W. J., Van Wessem, J. M., Van Meijgaard, E., Van As, D., Lenaerts, J.,… & Van Den Broeke, M. R. (2018). Modelling the climate and surface mass balance of polar ice sheets using RACMO2–Part 1: Greenland (1958–2016). The Cryosphere, 12(3), 811-831. Web.