Difference between the official cash rate and the market rate of interest
The official cash rate is the target set by the Reserve Bank of Australia (RBA). It is the guiding rate at which banks can transact overnight borrowing and lending on unsecured basis (RBA “Market Operations” 2012). RBA influences the volume of these operations through the settlement balances. The balances belong to the commercial banks. These are known as cash targets. As of 6th June 2012, the official cash rate by RBA was 3.50 percent.
As of 2nd May 2012, the official rate was 3.75 percent (RBA “Cash Rate Target” 2012). This was a decrease of 0.25%. According to Zettelmeyer (2000, p. 11), official cash rate target are “overnight interest rate targets”.
The market rate of interest is the rate that is set through the mechanism of demand and supply. The market rate will differ depending on different debt securities, and the official rate of interest. The other factors that determine market rate of interest are inflation rates, risk of security, and the marketability of security (Brigham & Ehrhardt 2011). Therefore, the market rate of interest is the rate that is used by traders in financial markets.
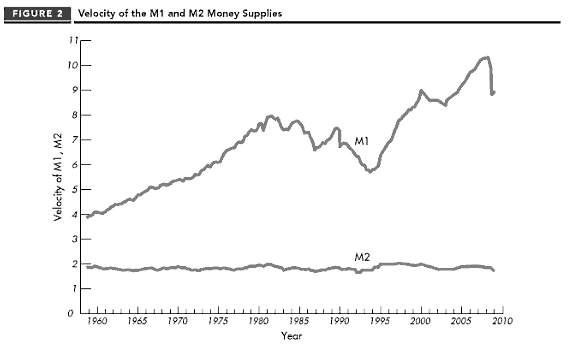
This graph obtained from Boyes & Melvin (2011, p. 296), shows how the Federal government of the US maintains the velocity of money M1 against the market velocity M2. In this diagram M2 indicates the rate at which commercial banks transact with the central bank while M1 indicates the rate at which the commercial banks and other financial institutions transact between each other, and the public. The velocity M2 is relatively stable because it is governed by the federal government while M1 is more volatile because it relies on market mechanism.
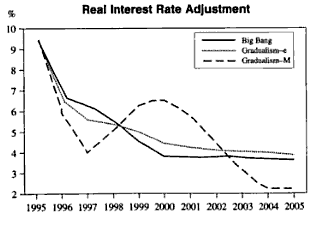
In figure 3 above obtained from Kwan & Chia, diagram 4.5b (1998, p. 92), Gradualism-e represents gradual liberation scenario. Gradualism –M represents a scenario that uses monetary policy to influence exchange rates. The big bang is the actual market rates. From figure 3, we can see that when Gradualism-e and Big Bang have low rates, as in case between the periods 1998 and 2002, the Gradualism-M rates are raised to bring the rates closer to the official rate. Using this diagram to illustrate the RBA policy to rates, the dotted line would indicate reactionary measures to bring the other two rates closer to the desired level.
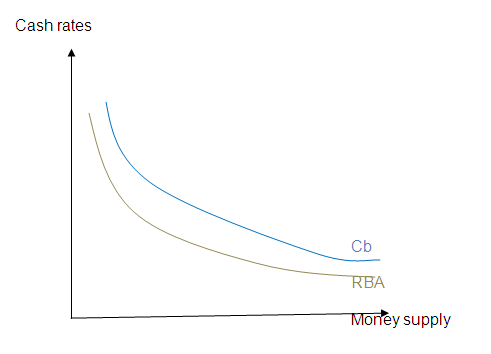
Diagram to show cash rates against money holdings- figure 4.A simple diagram to illustrate how the RBA uses money holdings to influence rates of interest would look like the one above. The RBA sets the percentage of cash holdings that commercial banks would be keeping. A bigger allowance for holdings increases money supply and lowers rates as banks have less need to borrow from one another. Commercial banks will also have more cash available to offer their customers. With each bank trying to entice borrowers, the market rate of interest decreases. Moreover, the RBA has to set the official cash rate as a guideline.
Effects of a decrease of the interest rate on consumption, investment expenditures, the level of aggregate demand, the inflation, and the unemployment rates
As shown in figure 5 below, decrease in interest rates makes the budget line to be less steep. The indifference curve shifts to capture the change in interest rates resulting in substitution effect and income effect (D’Souza 2008). This graph illustrates a case in which reduction in interest rates results in reduced consumption because of loss of purchasing power. The positive income effect loses its real value to inflationary effects because of increased money supply.
Diagram obtained from D’Souza (2008, p. 77) on the effects of changes in interest rates.
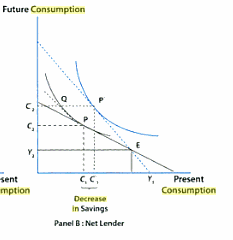
The blue broken line represents the old budget line, and the blue curve represents the old indifference curve. The black line represents the new budget line, and the black curve represents the new indifference curve. Low interest rates means people prefer present consumption to future consumption. That is the reason for the new budget line extending towards present consumption reducing the gradient of the new budget line.
Decrease in the interest rates may either decrease the rate of consumption or increase it depending on whether there is a positive or negative value from the difference in substitution effect and income effect. Decrease in interest rates increases consumption by causing savings to reduce through the substitution effect. It also reduces consumption through the loss of purchasing power (D’Souza 2008).
The loss of purchasing power is as a result of inflation caused by increased liquidity. If the loss from purchasing power is greater than the effect caused by reduced savings and increased nominal income then the level of consumption will still decrease despite reduction in interest rates.
Plotting spending against income Taylor and Weerapana (2009, p. 676).
Figure 6
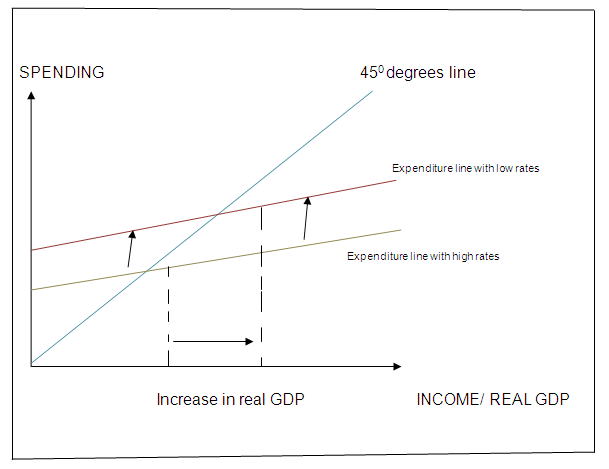
Figure 6 above illustrates the case where there is an increase in aggregate demand because substitution effect exceeds the negative impact of inflation. Low interest rates increases investment, net exports, and consumption which make the expenditure line to shift upwards. With increase in these components of aggregate demand, the unemployment level will decrease.
Credit creation process of banks and how it can be influenced by an expansionary monetary policy
Credit creation according to Somashekar (2009, p. 16), is the “the expansion of bank deposits through the process of more loans, advances, and investments”. Banks create credit by loans, bills of exchange as well as purchase of government securities. This is because when banks purchase government securities they do not complete the payments immediately but rather credit the government accounts with the price of the securities (Somashekar 2009).
When a bank offers loans to customers, it credits their accounts with the full amount but it is not required to keep holding the full amount in cash. The law restricts banks not to go below a certain percentage of the value offered. In most cases this percentage is around ten percent. The percentage of cash holdings by commercial may only be enough to meet public demand, and the statutory requirements. When people’s accounts are credited, the withdrawals are spent and once again the deposits by the public create more balances to give loans. What is notable about credit creation is that the balances in the accounts, if they are demanded at the same time, all cannot be liquidated into currency.
An expansionary monetary policy would give the commercial banks more cash holdings. This is because an expansionary monetary policy increases money supply in the economy. The public increase deposits into banks, this is if the interest rates remain preferential. An expansionary monetary policy would reduce interest rates inducing more borrowing because the cost of servicing loans would be cheaper.
List of References
Boyes, W, & Melvin, M 2011, Macroeconomics, Cengage Learning, Mason.
Brigham, F. E, & Ehrhardt, C. M 2011, Financial Management Theory and Practice,Cengage Learning, Mason.
D’Souza, E 2008, Macroeconomics, Pearson Education India, New Delhi.
Kwan, C.H, Vandenbrink, D., & Chia, Y. S 1998, Coping with Capital Flows in East Asia, Institute of SEA, Pasir Panjang.
RBA 2012, Cash Rate Target. Web.
RBA 2012, Market Operations. Web.
Somashekar, N. T 2009, Banking, New Age International. New York.
Taylor, B. J, & Weerapana, A 2009 , Economics, Houghton Mifflin Company, Boston.
Zettelmeyer, J 2000, The Impact of Monetary Policy on the Exchange Rate: Evidence from Three Small Open Economies, IMF, Washington D.C.