Executive Summary
This report focuses on the analysis of the financial performance of BGC Ltd. First, ratio analysis revealed significant issues with profitability, liquidity, and solvency associated with the COVID-19 pandemic and a decrease in sales. Second, the analysis of cash flows demonstrated that the company’s cash flow management strategy is inadequate due to the failure of planning the cash budget adjusting for the upcoming regular payments. Finally, the report explored the option of leaving the retail market and entering the domestic market in cleaning services. The results revealed that entering the domestic market is associated with increased opportunities to increase cash inflows.
Introduction
This report aims at analyzing the financial performance of BGC Ltd. during the past three years and providing recommendations for the company to modify its business to adapt to the new realities associated with the COVID-19 pandemic. This report aims at clarifying the issue of company’s financial underperformance and the company’s inadequate cash management. Additionally, the report aims at helping to make the decision between staying in the retail market and moving to the domestic market.
First, the report provides ratio analysis to evaluate the company’s profitability, efficiency, liquidity, and solvency. Second, the report provides a detailed discussion of the company’s cash flow statement and identification of possible threats associated with cash balance management. Third, the report appraises two opportunities for future growth. The report is concluded with a list of recommendations based on the results of the conducted analyses.
Ratio Analysis
Financial ratio analysis is one of the most frequently used quantitative methods for assessing the financial performance of firms by the investors (McLaney, 2009). Ratio analysis is beneficial for predicting stock prices and trends (Arkan, 2016). This section provides a discussion of profitability, efficiency, liquidity, and solvency ratios. All the calculations of the ratios for the past three years are provided in Appendix A. Data that was used for calculations is provided in Appendix B.
Profitability
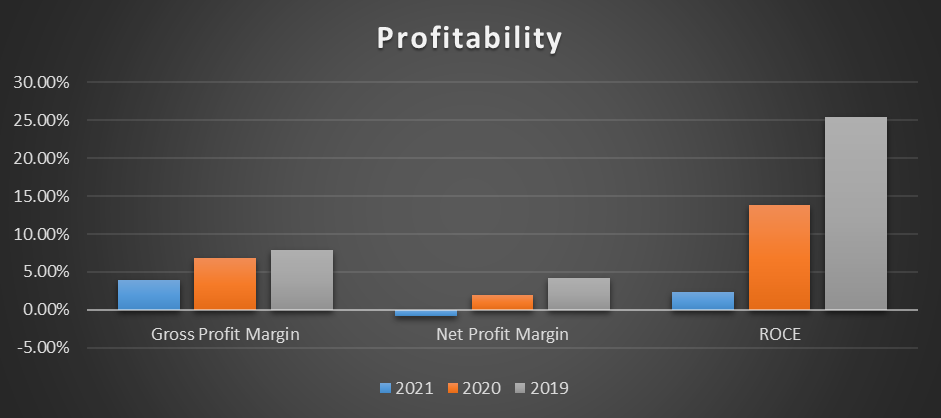
Profitability ratios usually include gross profit margin (GPM), net profit margin (NPM), and return on capital employed (ROCE) (Atrill and McLaney, 2015). The visualization of the profitability analysis is provided in Figure 1 below.

The analysis of profitability revealed that the company’s profitability was gradually decreasing between 2019 and 2021. Several reasons for that were identified based on the ratio analysis. First, GPM demonstrates that the costs of sales were increasing relatively to sales, which implies that the company failed to adjust the prices of its services, even though the cost of sales increased (Gowthorpe, 2021). Second, the fall in NPM demonstrated that the company failed to adjust its administrative expenses and other operating expenses enough to prevent losses (Gowthorpe, 2021). Finally, ROCE demonstrates that the efficiency of use of capital employed decreased between 2019 and 2021 (Amir and Kama, 2005). All of these effects may be attributed to the influence of the pandemic that caused the decrease in sales.
Efficiency
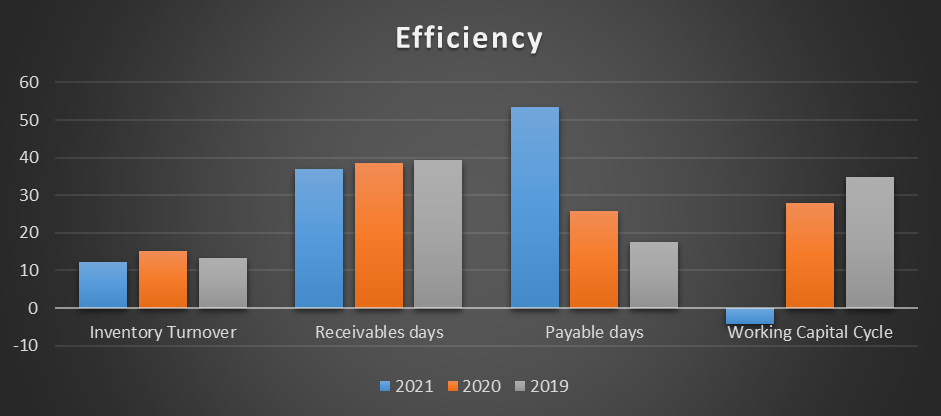
Efficiency was calculated using the working capital cycle ratio. The ratio is calculated using three other efficiency ratios, including inventory days, receivable days, and payable days (Atrill and McLaney, 2022). The results of the analysis are visualized in Figure 2 below.

The analysis of the working capital cycle revealed that the company was improved during the past three consecutive years (Elliott and Elliott, 2015). Working cycle capital decreased from 35 days in 2019 to -4 days in 2021. This implies that, in 2021, BGC was able to collect money faster than it was required to pay. The improvement was attributed to the company’s ability to delay its payouts to the suppliers, as the payable days increased significantly in 2021, while other elements of the ratio remained almost the same.
Liquidity
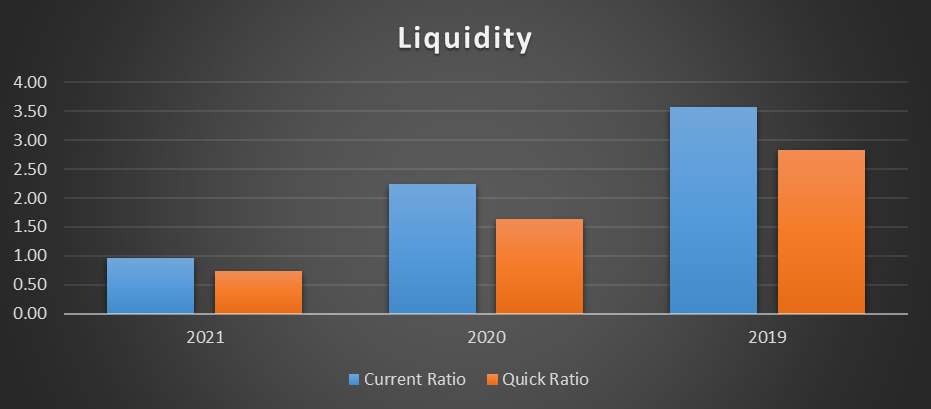
Liquidity was assessed using the current ratio and the quick ratio. According to Weetman (2016), the use of the quick ratio is crucial as it does not take into consideration the inventory, which may be difficult to turn into cash. The results of the analysis are visualized in Figure 3 below.

The analysis revealed that the company’s liquidity was decreasing gradually between 2019 and 2021. In 2021, both quick and current ratios were below 1, which demonstrated that the company did not have enough current assets to cover its short-term debt. This may cause significant issues, as the company may be forced to search for additional funds to cover its expenses. This may also cause problems with acquiring more loans from banks (Elliott and Elliott, 2015).
Solvency
The company’s long-term solvency was measured using the gearing and interest cover ratios. The results of the analysis are summarized in Table 1 below.
Table 1. Solvency ratios by year
The analysis revealed that the company’s performance in terms of solvency was decreasing during the past three years. The company needed to take additional debt to ensure the stability of its operations, which increased interest payments. Since the profitability of the company was decreasing significantly, the interest cover ratio also fell from 861 in 2019 to 2.04 in 2021, which is a sign of significant concern in terms of long-term solvency. At the same time, since the company did not increase its assets, the gearing ratio was also climbing from 18.82% in 2019 to 49.48% in 2021. While the gearing ratio is still acceptable, the interest cover ratio is very small, which may cause concerns among creditors and investors.
Cash Flow Statement Analysis
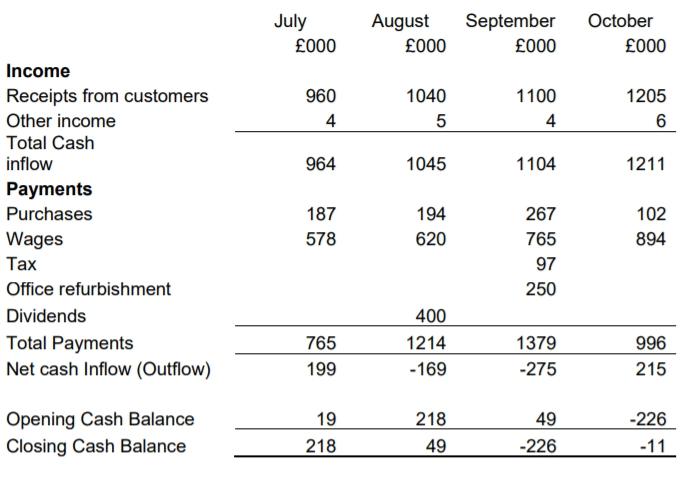
This part focuses on the analysis of BGC’s cash flow statement for the months of July – October. The cash flow statement is provided in Figure 4.

Threat Identification
The primary threat that the company faced was negative cashflows in August and September, which caused a deficit in cash available. The negative cash balance was caused by two predictable expenses, including dividends and office refurbishment payments. In October, the cash balance increased from -226 at the start of the period to -11 at the end of the period. However, it should be noticed that the increase in cash was caused by a decrease in purchases. This implies that the company increased its cash balance by selling off inventory.
Thus, the following threats were identified:
- Negative cash inflow during two months due to inadequate management.
- A possible shortage in inventory due to a decrease in purchases.
Implications for the Company
The negative cash flow and inadequate management of cash flows may lead to significant problems with liquidity (Allman-Ward and Allman-Ward, 2018). In other words, the company may face the problem of not having enough cash to cover its current expenses. As a result, BGC Ltd. will need to borrow money from creditors or raise funds through equity, which may be associated with additional expenses in the future (Atrill and McLaney, 2015). Moreover, liquidity problems may lead to decreased trust from creditors and stakeholders, which may require an increased rate of return to cover their risks (Allman-Ward and Allman-Ward, 2018).
A decrease in inventory may lead to the company’s inability to meet the needs of the customers. This will lead to the missed opportunity of sales, which will decrease revenues and profits (Weetman, 2016). However, sales of inventory may be favorable if the company has too much inventory in stock.
Possible Solutions
- Improve control over cash flows. The company needs to put more effort into planning cashflows to ensure that it does not face a cash deficit.
- Consider regularity and predictability. The company should ensure that it has enough cash to cover planned expenditures, such as dividend payouts and inventory purchases.
- Implement an inventory control system. This endeavor will help to optimize spending on inventory and prevent the company from inventory shortage.
Future Development
Profitability of Current Markets
Gross profit margins were calculated to understand which market (retail or office) was more profitable for the past three years. The results are provided in Table 2 below.
Table 2. Profitability of different markets (£000)
The analysis revealed that the office market was more profitable in terms of GPM for four consecutive years. Moreover, the sales and the profits in the retail market decreased significantly in 2021, which made the market less profitable in absolute values along with GPM.
Decision-Making Analysis
This section focuses on making the decision between carrying on in the retail and office sectors and shutting down the retail element, and move into the domestic market. Table 3 below demonstrates chance-adjusted net cash flows from the domestic market and the retail markets. The analysis demonstrates that moving to the domestic market is a more favorable option, as the adjusted net cash inflow from the retail market is below the predicted cash inflow from the domestic market, as the expected cash inflow from this option (£335,000) is higher than the expected cash inflow from continuing operations in the retail market.
Table 3. Projected cash inflow (£000)
Recommendations
This section provides a summary of recommendations based on the results of the analyses provided in Parts A-C of this report.
Recommendations based on the ratio analysis:
- Increase GPM by increasing the prices, reducing the costs, or a combination of two;
- Adjust operating and administrative expenses to increase NPM;
- Improve liquidity by controlling overhead expenses and revisiting debt obligations.
Recommendations based on the cash flow analysis:
- Improve control over cashflow to improve liquidity;
- Implement an inventory control system to ensure that there is enough inventory to continue operations.
Recommendation based on the decision-making analysis:
- Shut down the retail element and move into the domestic market as it is expected to be a more profitable option.
Conclusion
BGC Ltd. experienced a significant decline in financial performance in 2020 and 2021 due to the COVID-19 pandemic. Thus, significant change in financial management is required to improve the situation. This report demonstrated that the company needs to make alterations in its pricing policy, inventory management, and cash flow management. Additionally, it was concluded that abandoning the retail market and entering the domestic market can help to increase the company’s profits.
Reference List
Allman-Ward, M. and Allman-Ward, P. A. (2018) Optimizing company cash. A guide for financial professionals. New Jersey: Wiley.
Amir, E. and Kama, I. (2005) The Market Reaction to ROCE and ROCE Components.
Arkan, T. (2016) ‘The importance of financial ratios in predicting stock price trends: A case study in emerging markets’, Finance, Rynki Finansowe, Ubezpieczenia, 79, pp. 13-26.
Atrill, P. and McLaney, E. J. (2015) Management accounting for decision-makers. New York: Pearson.
Atrill, O. and McLaney, E. J. (2022) Accounting and finance for non-specialists. New York: Pearson.
Elliott, B. and Elliott, J. (2015) Financial accounting and reporting. New York: Pearson.
Gowthorpe, C. (2021) Business accounting and finance. Boston: Cengage Learning.
McLaney, E. J. (2009) Business finance: Theory and practice. New Jersey: Prentice-Hall/Financial Times.
Weetman, P. (2016) Financial and management accounting: An introduction. New York: Pearson Education.