PLA is short for Polylactic acid and the formal name is polylactide. It is biodegradable, thermoplastic polymer and derived from renewable resources, such as corn starch and sugarcane. Sometimes, we denote PLA as corn plastic as it can be derived from corn. Green product packaging is preferred by consumers and governments as they are environment friendly. PLA is also a sustainable alternative to the petrochemical-derived products, since the lactides from which it is ultimately produced can be derived from the fermentation of agricultural by-products such as corn starch or other carbohydrate-rich substances like maize, sugar or wheat.
Although PLA is a polymer and can completely degrade in nature, its mechanical and chemical properties are not suited for high temperature applications, and in transportation and storage. There are many PLA manufactures such as NatureWorks LLC, an American company, Toyota, a Japanese company, and some companies in the Netherlands and China. There are different forms of PLA for different applications. As this project is going to investigate the types of PLA and blends/composites commonly used in daily life, the project is envisaged to study the effect of temperature, radiation, humidity and pH, and composting conditions on PLA products. According to the experimental results, the recommendations will be made and practical applicability will be discussed.
Project Background
Nowadays people are concerned about environment protection and have recognized its importance. To protect the environment and personal heath, consumers would like to use environment friendly products. The manufacturers would like to use cheaper raw material to produce products in order to optimize profit and fulfill customer requirements and government legislation. PLA is a reasonably biodegradable material mostly used for packaging derived from nature resource such as starch and sugarcane. PLA is currently used in a number of biomedical applications too, such as sutures, dialysis media and drug delivery devices, and it is also evaluated as a material for tissue engineering.
PLA also has many potential household uses, for example in upholstery, disposable garments, feminine hygiene products and nappies. Unfortunately, PLA also has limitations at high temperature and humid conditions as it degrades fast. The limitations depend on the type of the PLA in particular the composition of D- and L-lactic acid in final product. The project is led by PolyU Eco design team, which is focusing on developing product in an eco perspective. As the applicability of PLA would vary with the temperature and affected by humidity, the project is going to study the performance of certain PLA at different temperature, humidity and pH, and will be compared with the other currently used packaging material to enumerate the superiority of PLA.
Reasons to this project
As a biodegradable product, PLA degrades at high temperature and humid condition. As the glass transition temperature is around 50-60°C, the mechanical and chemical properties may change into different state when the temperature rises over glass transition temperature. Although the degradation rate is slow at low temperature, it also may have slight influence on the performance even at room temperature. In our daily life, PLA made products undergo high temperature changes above glass transition temperature but below the melting point. The project is going to evaluate the use of PLA at low and high temperatures, and the measurements will be based on the weight loss and change in mechanical and degradation property.
Problem identification
This is my final year project which will only go through the whole study year. As there is time limitation, I cannot take many readings and try many types of experiments. The experimental design will select typical parameters so as to simulate the similar usage environment. Since I am not an expert in mathematical modeling and designing complex experiments, comprehensive data analysis will not be done at this level. Moreover, funds are limited and experimental equipments are housed at the Hong Kong Polytechnic University (PolyU), and many of them are from PCB Center and Material Research Center. Because of the above strategic and material limitations, the study will focus on rather selected types of PLA/blends.
Project Objectives
- Melt/Solid Condensation and effect of catalysts on PLA properties,
- Gamma radiation and thermal and thermomechanical properties of PLA,
- Thermal properties of PLA and PLA blends/composites with glycolic acid, starch and cellulose fibers, and
- Biodegradation characteristics of PLA material in compost and solutions – pH, humidity, temperature, carbon balance, microorganisms and enzymes.
Scope
The project will focus on three points-
- Investigate on certain packaging guidelines, standards and directives and figure out different eco perspectives.
- Study on existing packaging products using PLA.
- Develop specific packaging recommendations to various industries.
Literature Review
What Is Packaging
Packaging is a result of long development process and continuous research aimed at finding better methods of packaging various goods we use in order to provide the best protection for them. If all kinds of goods adapt efficient packaging, we may move our lifestyle to dependable and available agricultural sources and manage them in long run. Packaging is the science, art and technology of enclosing or protecting products for distribution, storage, sale, and use. Packaging also refers to the process of design, evaluation, and production of packages. In general, packaging is used for four purposes:
- Contain products, defining the amount the consumer will purchase,
- Protects products from contamination, from environmental damage and theft,
- Facilitate transportation, and
- Carry information and colorful designs that make attractive displays

Package can be placed into three categories: flexible, semi-flexible and rigid. Flexible packaging includes the paper sacks to carry food items, plastic bags to hold potato chips and the paper or plastic sacks in which our household purchases are carried. Paperboard box is semi-flexible packaging, where cereal, many other food products, small household items, and many toys are packaged in. For many non-food items, the packaging is made more rigid to hold the product and its accessories or components in place. Forms of rigid packaging include crates, glass bottles, and metal cans.
The Packaging History
In the early times, human consumed food where ever it was found, and they were also self-sufficient, and then there was little need for packaging of goods or food, either for storage or transportation. They used gourds, shells, and leaves provided by nature as containers. Later, these containers were developed from natural materials, such as hollowed logs, woven grasses and animal organs.
Fabrics from fur were used as primitive clothing. Fibers were woven into felts. These fabrics were made into garments, used to wrap products or formed into bags. With the weaving process, grasses, and later reeds, were made into baskets to store foods. And then some foods could be saved for future meals and less time was needed for seeking and gathering food.
When ores and minerals were discovered, metal and pottery came in to existence, leading to other packaging forms. A brief review of the main packaging developments is discussed in the later section.
Paper and Paper Products
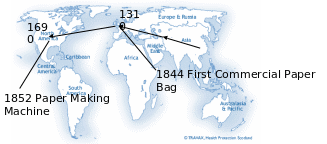
Paper is the oldest form of flexible packaging. Chinese are the first to use flexible packages. They used sheets of treated mulberry bark to wrap foods as early as the First or Second Century B.C. During the next fifteen hundred years, the paper-making technique was developed and refined by Chinese, and transported to the Middle East, then Europe and finally into the United Kingdom in 1310. Eventually, the technique arrived in America in Germantown, Pennsylvania, in 1690.
But these first papers were somewhat different from those used today. Early paper was made from flax fibers and later old linen rags. The material of making paper began to use pulp after 1867.
The first commercial paper bag was manufactured in Bristol, England, in 1844, and shortly thereafter, in 1852, Francis Wolle invented the bag-making machine in United States. Further developments during the 1870s included glued paper sacks and the gusset design. After the turn of the Century (1905), the machinery was introduced to automatically produce in-line printed paper bags.
With the development of the glued paper sack, it replaced the cotton flour sacks which are more expensive. And a sturdier multi-walled paper sack for larger quantities replaced cloth after 1925 when a means of sewing the ends was finally invented.
The first commercial cardboard box was produced in England in 1817, and it was two hundred years later, the Chinese invented cardboard. Corrugated paper appeared in the 1850s, and shipping cartons of faced corrugated paperboard began to replace self-made wooden crates and boxes used for transportation in 1900.
Robert Gair was a Brooklyn printer and paper-bag maker during the 1870s accidentally invented carton. While he was printing an order of seed bags, a metal rule normally used to crease bags shifted in position and cut the bag. Gair concluded that cutting and creasing paperboard in one operation would have advantages, then the first automatically made carton was created, which was referred to as “semi-flexible packaging”.
Paper and paperboard packaging increased in popularity well in 20th century. Then with the advent of plastics which had a significant role in packaging (late 1970s and early 1980s), paper and its related products tended to decrease in use. Lately the trend has been slowed down as designers tried to respond to environmental concerns.
Glass
Glass-making began in 7000 B.C. as an offshoot of pottery, but it was first industrialized in Egypt in 1500 B.C. Made from base materials (limestone, soda, sand and silica), which were in abundant supply, all ingredients were simply melted together and molded while hot.
At first, ropes of molten glass were coiled into shapes and fused together. By 1200 B.C., glass was pressed into molds to make cups and bowls. The Phoenicians invented blowpipe in 300 B.C., the technique speeded production and allowed for producing round containers. Colors were available from the beginning, but obviously, transparent glass was not discovered until the start of the Christian Era. The process spread steadily, but slowly, across Europe in the next 1000 years.
The split mold developed in the 17th and 18th Centuries helped to make irregular shapes and raised decorations. As techniques were further refined in the 18th and 19th Centuries, prices of glass containers continued to decrease. The first automatic rotary bottle- making machine was patented in 1889.
Consequently, as other rigid packaging products such as metals and plastics were gaining popularity in the 1970s, packaging in glass tended to be reserved for high-value products.
Metals
Ancient boxes and cups were made from silver and gold, and other metal alloys with thinner gauge and coatings were developed subsequently.
The process of tin plating was discovered in Bohemia in 1200 A.D. and cans of iron, coated with tin were known in Bavaria as early as the 14th century. The secret of plating process was kept for long until in 1600s it was stolen by Duke of Saxony. It spread across to France and the United Kingdom in early 19th century. After William Underwood transferred the process to the United States via Boston, steel replaced iron.
In 1809, General Napoleon Bonaparte offered 12,000 francs to anyone who could preserve food for his army. In 1810, an Englishman, Peter Durand was granted a patent for his idea of preserving food in “vessels of glass, pottery, tin, or other metals or fit materials.” Durand’s patent was based on 15 years of experimentation with a Frenchman, Nicolas François Appert, who developed the idea of preserving food in bottles. Durand sold his patent to two other Englishmen, Bryan Donkin and John Hall, who set up a commercial canning factory and by 1813 were producing their first canned goods for the British army and by 1866 the first printed metal boxes were made in the United States for cakes of Dr. Lyon’s tooth powder.
The first aluminum foil containers were designed in the early 1950s while the aluminum can appeared in 1959. Until 1866, a hammer and chisel was the only method to open the can. It was then that the metal tear-strip was developed. Nine years later (1875), the can opener was invented. For more than 100 years, the can opener was the most efficient method to open the can. In the 1950s, the pop top/tear tab can lid appeared and now tear tapes that open and reseal are popular.
Collapsible, soft metal tubes, today known as “flexible packaging,” were first used for artist’s paints in 1841. Toothpaste was invented in the 1890s and started to appear in collapsible metal tubes. Later, aluminum was changed to plastic for such food items as sandwich pastes, cake cream etc.
Plastics
Plastic is the latest material among the packaging materials. Although discovered in the 19th century, most plastics were used for military purpose. Styrene was first distilled from a balsam tree in 1883. Germany refined the process in 1933 and by the 1950s foam was available worldwide. Vinyl chloride discovered in 1835, provided for the further development of rubber chemistry. The Polyethylene tetra-phthalate (PETE) container became available during the last two decades with its use for stocking aerated drinks entering the market in 1977.
Current packaging designs are beginning to incorporate recyclable and recycled plastics but the search for reuse functions continues. It will be the trend for material, from the nature and go back to nature.
What is Eco-packaging
Eco-packaging is the word combined with Eco and packaging. This means the product should fulfill “eco” and “packaging” criteria. Packaging that still fulfils its functions but has less environmental impact over its lifecycle.
Why do we need Eco-packaging
With environment getting inhospitable, people are becoming more concerned on environment protection, and the consumers are becoming increasingly interested in its environmental profile. Eco-packaging helps company compliance with global packaging regulations and its adaptation becomes company’s social responsibility. It improves company’s image and reputation. “Reducing household waste” and “Zero landfill” targets are international priorities, if we do not do anything, these wastes will cost money and resource, and landfill sites will fill up to maximum capacity.
How to realize Eco-packaging
We can consider eco-packaging based on 6”R”s, they are Remove, Reduce, Reuse, Renew, Recycle, and Revenue.
- Remove – means we should eliminate unnecessary packaging parts minimal used material and energy. For example, if we change a product’s package from a card box with a laminate plastic window to a plain card box with a product picture. It not only saves the material used for packaging, but save the energy for recycling.
- Reduce – means the packaging would use the suitable size. As Kid Connection?, the package is Double Wall Corrugated and then converted to stronger Single Wall Corrugated. The change not only saves the material, but also space in warehouse, and saves the subsequent transportation fee.
- Reuse – materials when designed for reuse becomes economical. Such as transportation packages, they can be used many times. So we can choose rigid packaging to be used repeatedly.
- Renew – materials can be biodegradable or reused. Such as PLA (Poly Lactic Acid) and bamboo fiber are both biodegradable material, and both of them are from nature. They are natural material, which means they are environmental friendly.
- Recycle – recycle(able) package is made by materials made of high recycled content. Many cables are made by recycle material. Recycled material uses less energy than virgin material, and also has lower price. With the process development, now, recycled materials are as good as virgin.
- Revenue – as company they need to make profit. All above rules will cut cost on packaging and in long term it will turn out to be better for environment.
Achievements
Based on eco design, the average weight of glass containers has been reduced by about 30% since 1980 and the thickness of supermarket carrier bags has been reduced by about 45% over the last 15 years. In the 1990s, juice cartons were made about 15% lighter and the aluminum foil layer became 30% thinner. The achievement not only saved material, but had an impact in transportation and warehousing.
For instance, the largest super market chain Wal-Mart planed to investigate its 60,000 suppliers on their ability to develop eco-packaging in 2007, and the result is that the new package saves one of its supplier Unilever 500 million gallons in water, 26 million gallons of diesel fuel, 150 million pounds of plastic resin and 750 million sq. ft of paperboard each year. The plan created $10.98 billion in total savings and prevented 667,000 metric tons of carbon dioxide from entering the atmosphere. It also results in $3.4 billion in savings for Wal-Mart.
Increased Use of Plastic Products
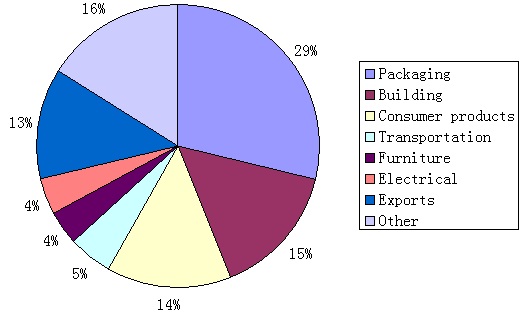
Since Nylon was introduced in 1935 by Dupont, plastic products have been used all around our daily life, such as building, packaging, consumer products, furniture etc. As Figure 3.1, most of plastics are used for packaging, it accounts for 29% in total.
With the increased use of plastics, people have become concerned over its impact on the environment. Most of plastics are made from petroleum, natural gas, and coal. They are the feed-stocks of the plastics industry, which are nonrenewable. Besides, energy crisis, it also causes environmental problem as too much plastic cannot be degraded in a short time. In the United States, the waste weight of the plastics account for 10% of the total weight and 18% of the total volume of municipal solid waste (Stevens, 2002). To solve the problem, there are innovations in line of new kind of material that can be degraded quickly instead of normal plastic.
According to Yang (2007), petroleum consumption can be reduced to 30%-50%, if we use the material obtained from natural resources (biomass) such as starch, plant fiber etc. PLA and Bamboo fiber are biodegradable materials obtained from starch, potato or plant fiber, and can be degraded by microbes. As eco-packaging principal, we can adapt biodegradable material in packaging as they are renewable. The American Society for Testing of Materials (ASTM) and the International Standards Organization (ISO) define degradable plastics as those which undergo a significant change in chemical structure under specific environmental conditions. These changes result in a loss of physical and mechanical properties.
Poly lactic acid
PLA is a biodegradable, thermoplastic, high-strength, high-modulus polymer, and is the only transparent biodegradable material. It is obtained from biomass such as corn starch, potato etc. The glass temperature and melting temperatures are around 60°C and 175°C, respectively. It can be processed as any other normal plastic material, such as injection molding, stretch blow molding, cast film and sheet, extrusion blown film etc. The application of PLA can be in the area of degradable and absorbable sutures, cloth, spine, daily life product, agriculture, packaging etc. PLA can be degraded completely; first it is hydrolyzed to low polymers, and then degraded further by microbes. PLA has passed food contact safety certifications in the U.S., Europe, and Japan.
Synthesis
Lactic acid is the basic building block of PLA, and it was first isolated from sour milk by the Swedish chemist Scheele in 1780 and commercialized in 1881 (Hartmann, 1998). Lactic acid mostly used in food related applications in the U.S., and about 85% of the commercially produced products use lactic acid as a buffering agent, acidic flavoring agent, acidulate, and bacterial inhibitor (Garlotta, 2001). We also can find it in many natural foods and in fermented foods such as yogurt, buttermilk and others. NatureWorks LLC applies corn starch as raw material to obtain lactic acid, whereas Toyato has proposed to use potato as raw material. The recent research is focusing on using non-food material to obtain lactic acid as there is also food insecurity worldwide.

Lactic acid can be produced in two ways, chemical synthesis which accounts for 30% in total production and fermentation which accounts for 70% in total (Chen Ling, 2006). In general, most of sugars obtained from agricultural byproducts can be used for fermentation to obtain lactic acid (Garlotta, 2001). Commercially produced lactic acid is made by the bacterial fermentation of carbohydrates, which conducted in batch process that takes three-six days to complete. The rate of the production is about 2 grams of acid per 1 liter of broth per hour. If the efficiency of production is improvised, it can lead to higher concentrations of the lactic acid, which may cause toxicity and growth inhibition of fermenting micro-organism. Addition of calcium lactate broth or calcium carbon can maintain cell growth and production.
PLA is the polyester synthesized from lactic acid, and there are two main routes. Basically three forms of PLA are produced: PLLA (L-form), PDLA (D-form), and P (D, L)-M (Meso-form). The L-form, which rotates polarized light in a clockwise direction, the D-form rotates polarized light in a counter-clockwise direction, and the Meso-form is optically inactive. The first route for manufacture is condensation polymerization of lactic acid to yield a low molecular weight, brittle, glassy polymer, and then using coupling reagents to increase the molecular weight of the polymer. The method is the cheapest way to polymerize PLA, but it is difficult to obtain high molecular weight PLA.
As mentioned, we should use external agents to increase the molecular weight, which will influence the purity of the PLA. Although esterification-promoting adjutants are one kind of external agents which can be filtered out during the final purification steps, it costs high. The second method is to collect, purify, and ring-open polymerize (ROP) lactides to yield high-molecular-weight PLA. ROP is one of the methods of producing pure and high-molecular-weight PLA, and has been introduced by Mitsui Toastsu Chemicals. They use lactic acid to react with one kind of catalyst to obtain pure PLA with weight-average molecular weights greater than 300,300 (Garlotta, 2001). PLA has various industrial applications and it has become very important as a leading bioplastic material.
Properties
The standard physical properties that are often used to characterize plastics are glass temperature, tensile strength, indentation hardness, elongation, loss of volatile components, barrier to oxygen, barrier to moisture, oil resistance, ease of marring, fold resilience, and tear resistance (Stevens, 2002).
General Properties
PLA is thermoplastic and saturated polyester in polymer type. There are three forms, PLLA (L-form), PDLA (D-form), and P (D, L)-M (Meso form). The molecular formula is (C3H4O2)n, and it is made up of lactides. Physical and chemical properties are different in different forms.
Physical properties
At room temperature, PLA is a crystal polymer with glass transition temperature between 55°C and 65°C (Verlag, 2003). The physical properties of PLA can be improved by chemical and physical modifications. Physical modification is a simpler and easier way, such as orientation, thermoformed, plasticization, filling with natural fibrous fillers etc. (Galeski et al.? 2008). Tensile modulus is increased by filling with natural fibrous fillers such as hemp fibers, grinded cacao shells, grinded apple pomace, oat chaff etc., and durability can be recovered by plasticizing with poly-(propylene glycol) (PPG) or poly-(ethylene glycol) (PEG).
D-lactide can influence glass temperature of PLA, more D-lactide, lowers the glass temperature and melting point (Yang, 2007). According to (Galeski et al.? 2008), the increase of crystallinity can improve the stiffness and heat resistance of PLA, and the melting point decreases with increasing of D-isomer’s content. PLA with < 8% D-lactide can be semicrystalline. Pure PDLA or PLLA has an equilibrium crystalline melting point of 207°C (Garlotta, 2001), but typical melting points are between 170°C – 180°C. The properties of unorientated and orientated PLA studied by Lalla & Chugh (1990) are listed in Table 3.1.
Table 3.1 PLLA and PDLLA main properties (Yang, 2007).
The results of oriented PLA are depended on the degree of orientation and isomer content and it causes wide range of properties (Table 3.2).
Table 3.2 Comparison of Physical Properties of High-Molecular-Weight PLA (Garlotta, 2002)
Glass and Melting Temperature
The glass transition of a polymer material refers to the heat-induced change from a brittle, glassy solid to a flexible, pliable solid, or the reverse change by cooling-induced (Stevens, 2007). The symbol for glass temperature is Tg which indicate the temperature where the state begin to change. Tg of typical PLA is between 50°C and 80°C. The melting temperature is between 130°C and 180°C.
Solubility
At 25°C, the reference solubility of PLA is between 19-20.5 MPa0.5, for PET is 16 MPa0.5 and 19 MPa0.5 for PS. According to Kharas (1994), PLA can be dissolved in dioxane, acetonitrile, chloroform, dichloromethane, 1,1,2-chloroform and di-chloroacetic acid. Methylbenzene, ethylbenzene, acetone and diethylene oxide can dissolve part of cold PLA, and can dissolve PLA completely after boiling the solvent. All kinds of PLA cannot be dissolved in water, alcohol or alkanes. PLA coated paper has high oil resistance. The test form from Yang (2007) is as follows:
Table 3.3 Oil resistance test of PLA coated paper.
Permeability
Table 3.4 shows the comparison of PLA, PS and PET films in permeability.
Table 3.4 Permeability of PLA, PS and PET films (25°C, 0% RH) (Yang, 2007).
PLA has good permeability in O2 and water vapor, the performance is as good as the best cellophane. It can be used to replace OPS film in vegetable and fruit packaging (Yang, 2007). Although PLA film has good O2 and vapor permeability, it has good barrier to citropten which is a flavor constituent.
Combustibility
PLA generates less smoke and heat when burnt. Table 3.5 shows enthalpy of PLA and other plastics.
Table 3.5 Enthalpy of PLA and other plastics.
The inflammability characteristic of PLA is better than un-filled or un-treated plastics. When it burns, it releases significantly less visible smoke than other materials. It means visibility fire hazards are reduced. Further, the peak energy release rate of burning PLA is less than 60% of PET. Burning property of PLA also makes PLA fibers attractive for use in upholstery, upholstery backings, and other furniture fabrics as well as window dressings such as drapes, linings and pleated blinds.
Sustainability
The ability of PLA to be completely recycled at the molecular level and by natural processes is summed up in the term “sustainability.” PLA can be hydrolyzed at 98% humidity and 60°C or higher, and then it is consumed by microbes (Lunt, 2000) and its component molecules can be converted for growing more corn, beet, rice etc., again making it possible to produce PLA for future needs. Although PLA can return to nature, it is not a perfectly sustainable polymer in terms of energy balance, as some excess energy is required for its polymerization. Notwithstanding, PLA is more sustainable compared to other equivalent polymers. According to Yang (2007), PLA consumes 56MJ/kg petroleum energy in production, whereas PS consumes 69MJ/kg, and if PLA replaces PS, it can reduce 20% petroleum consumption load.
Durability
PLA has very good durability in most applications. While some biodegradable polymers are available to be consumed by microbes as soon as they encounter with each other, PLA is not biodegradable in “normal” state. Instead, it has to be hydrolyzed to a significant level by bringing relative humidity and temperature at or above 98% and 60°C, respectively (Lunt, 2000). So it is easy to know that for most applications, durability concerns should not be an issue for PLA.
Dyeability
The critical surface tension of PLA is 38-42 mN/m, therefore PLA is easy to print and metallise.
Table 3.6 Surface tension of PLA, PE, PP, PET and PS
Biodegradable
PLA is biodegradable by hydrolysis of scissions of the ester groups in the molecular chain. High-molecular-weight PLA is reduced to low molecular weight, and then degraded by microbes with the generation of carbon dioxide and water. PLA can degrade rapidly in high humidity and the temperature around glass temperature (55-70°C). Table xxx shows typical degradation times at different temperatures and air humidity (Bosiers, 2003).
Table 3.7 Degradation of PLA in different conditions.
According to table 3.7, temperature and air humidity have significant impact on degradation of PLA. The degradation is less within 20% and 80% humidity and below 25°C, but it increases sharply as temperatures rises to 25°C, 40°C and 60°C and humidity level is under 80% humidity (Bigg, 1996). The significant degradation occurs starting at a temperature 10°C above the melting point.
UV Absorption
Many kinds of food stuffs such as juice, vitamin, beverage, milk, butter etc. are affected by UV absorption. As packaging material, the absorption of UV will determine the quality of the food. According to wavelength, UV can be sorted into four ranges: UV-A (320-400 nm), UV-B (275-320 nm), UV-C (200-275 nm) and UV-D (100-200 nm). UV-A has lower energy, it can blacken skin. UV-B has the highest energy, it can degrade plastic. UV-C comes from man made light, because it is absorbed completely in atmosphere. Figure 4.1 shows the transmittance of PLA, PET, PS, LDPE and cellophane.
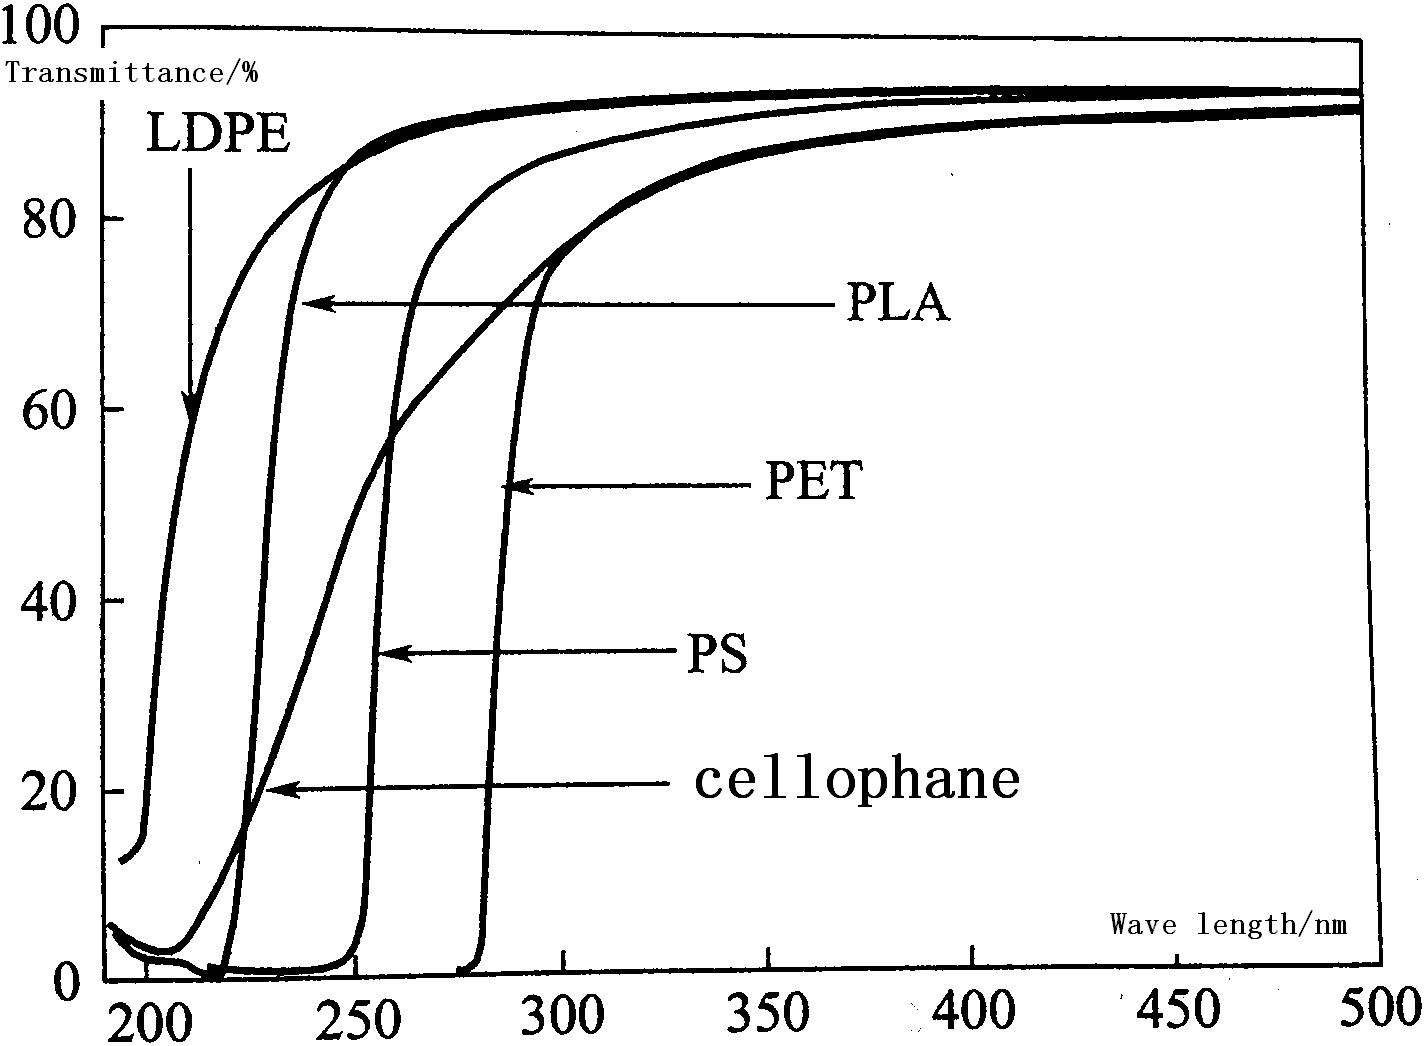
According to the figure 3.1, PLA can block almost all UV-C (190-220nm), but transmittance rate increases when the wave length is longer than 225nm. About 85% of UV at 250nm passes through PLA, and 95% of 300nm. This means that most of UV-A and UB-B can pass through PLA. PLA’s transmittance to UV-C is lower than LDPE, but for UV-A and UV-B it is higher than PET, PS and cellophane. Therefore, UV stabilizing agent needs to be added when the film is used for food packaging such as milk.
Food contact assessment
Lactic acid is the ultimate product of hydrolysis of PLA which may migrate into food stuff. Lactic acid is food becomes a parameter to evaluate the safety of PLA. The substance (L-isomer, D-isomer, DL mixture) was affirmed as GRAS in 1984 by the FDA for individuals beyond infancy, because of the limitation of the infants to metabolize the D-isomer of lactic acid which might lead to organic acidosis [Select Committee on GRAS Substances (SCOGS), 1978]. Although the Joint FAO/WHO Expert Committee on Food Additives (JECFA) has set no limits on the addition of lactic acid, they recommend that neither the D-lactic acid nor DL-lactic acid be added to formulas for infants less than 3 months of age. The Japanese Standards of Food Additives has set a maximum of 10,000ppm calcium in the form of added calcium lactate, but has set no limits for lactic acid.
Conn et al. (1994) indicated that the amount of PLA (and its equivalent amount of lactic acid) migrating to the food from different types of food packaging materials and from food containers or utensils should be very small.
Drawbacks
A property of PLA that has figured out somewhat unsuitable for its application is PLA’s relatively poor abrasion resistance. The obstacle limits the use of PLA fibers in some high-performance cloth applications, in ropes, or in other uses where high abrasion resistance is required.
Another drawback is PLA’s relatively low melting temperature. Even the most crystalline form melts at about 175°C PLA’s performance in high-temperature environments would still be rather unsatisfactory.
Packaging Applications
PLA can be the material for packaging, because it has suitable properties as mentioned above. All governments, particularly of China (Chau et al. 1996) and Germany (Bastioli 1998), have support to use biodegradable material in packaging in order to reduce white pollution, landfills etc. There are about 41% of plastics used in packaging. Over 67 million ton of packaging wastes are generated annually in the EU, comprising about one third of total municipal solid waste (Klingbeil, 2000).
Food packaging is considered as the largest application area for PLA (Yang, 2007). Food containers and packages are always abandoned with household garbage since PLA material can be degraded with household garbage. Besides this PLA is transparent and foldable, and it has low temperature heat sealing, thermal contraction, safety food contact and retains the flavor. PLA packaging is extensively used for vegetable and fruit, and also for rubbish package.
PLA film can be used for label, plastic window, of envelopes, and disc packaging. PLA material can be used to produce bottles. Compared to PET bottles, PLA bottles are more transparent and have high tensile strength and stiffness. The disadvantage is that PLA bottles need strict processing requirement and it cannot sustain high temperature. The permeability of PLA is lower than TET, hence, PLA can be used for packaging of only short-term food with carbonic acid, such as water, juice, milk etc.
PLA foam has similar properties to that of Expanded polystyrene (EPS). According to Yang (2007) it has better cushion performance, chemical resistance and heat insulation. PLA foam can be made by equipment the same as EPS’s. So PLA foam can replace EPS as cushion material, heat insulation packaging, filling material etc. The drawbacks are high cost and heat susceptibility.
Methodology
Raw material
Raw materials 2002D, 3051D and 4032D were purchased from nature works LLC. They have good performance in different production. The products fabricated from 2002D, 3051D and 4032D can cover most of our daily life applications. So investigating these three model materials can cover PLA’s general applications. Samples of 2002D, 3051D and 4032D are produced by injection molding and extruders.
2002D PLA: 2002D PLA can be easily processed on conventional extrusion and other thermoforming equipments and applications include dairy containers (food container), blister packaging and cold drink cups.
3051D PLA: 3051D PLA can be processed on conventional injection molding equipment. And products include cutlery, cups, plates and saucers and outdoor novelties.
4032D PLA: 4032D PLA can be processed on conventional extruders. It can be converted into a biaxially oriented film and it can sustain high temperature up to 150°C. According to NatureWorks, PLA Polymer 4032D Technical data sheet, the film of 4032D has quite good optics, and good machinability, twist and deadfold. And it is also barrier to flavor and grease and oil resistance. The product application can apply to laminations, printed films and packaging applications such as fruit packages, vegetable packages and etc.
Table 4.1 Properties of Test materials.
Flexural Strength (2) Flexural Modulus
Cornstarch: Cornstarch was procured from Shindongband Inc., Korea and Bazancourt, France.
Abaca, a cellulose fiber in thread form, was obtained from Manila Cordage, Rieter Automotive: Man-made cellulose thread was obtained from Cordenka GmbH.
Test Samples Format
Samples of 2002D are small size pellets to ensure heat conduction well and the sample weight is 50 mg as the equipment can hold the sample from 0.1mg to 100 mg. Too large sample size will influence the heat conduction as well as small size sample will show the unstable result.
Samples of 3051D are strip type, square shape, and the size is 50±1mm, and the thickness should be less than 25mm.
Samples of 4032D are film type, square shape, and the size is 50±1mm, and the thickness is about 0.1mm.
Cornstarch is fine granulated material with 11% inherent moisture.
Abaca is of diameter 150+/-50 µm, tensile strength 100 kg, and fiber quality S3 duo to Fiber Industry Development Authority. Man made fiber type Cordenka® 700 Super3, dtex=2440, monofilaments 1350, tensile strength 128.6 N, fiber diameter 12 µm.
Test Methods
Synthesis PLA blends/composites, modifications and fiber reinforcements
PLA produced from L-lactic acid (PLLA) are typically crystalline in nature, those from a mixture of D- and L- lactic acids (D-form > 15%; PDLLA) are mostly amorphous with little crystalline property and those of only the D-form are authentically amorphous PLA polymers (PDLA). PDLLA should be considered as a blend of two optical forms of LA. Such blended PLA synthesis by melt/solid polycondensation was reported by Essawy, Helaly & Shabana (2007). A variable mixture of D- and L- lactic acids was dehydrated at increasing temperature up to 150°C in a reflux apparatus.
After retaining the sample at atmospheric pressure for 2 h, the pressure was reduced stepwise to 100 torr for 2 h and then to 30 torr for 4 h. Viscous liquid of oligolactic acid was formed. As a catalyst in the polycondensation either a mixture of stannous chloride (SnCl2 2H2O) and p-toluene sulfonic acid (PTSA) or antimony oxide (Sb2O3) was added. The mixture was further heated at 180°C until viscosity did not further intensify. Pressure was reduced to 10 torr and reaction was continued up to 5 h (melt polycondensation). The resulting condensate (PDLLA) was cooled to obtain white solid polymer. This was crushed in to granules and again heated at 105°C for 2 h or 75°C for 12 h under vacuum for annealing. This step is needed to develop the crystallites.
One of the modifications in commercial PLLA has been by γ-radiolysis to intensify the cross-linking (Babanalbandi, Hill, Hunter & Kettle, 1999; Nugroho & Mitomo, 2008), which is believed to strengthen thermal and mechanical properties of the polymer. For thermogravimetric analysis (TGA) PLA powder were transferred in glass ampoules and evacuated for 24 h to 10-3 Pa pressure. Ampoules were also sealed without evacuation but flushed with O2 and N2.
Irradiation was done at 25°C with γ-rays at a dose rate of 10 kGy/h using 60Co γ-ray source. Irradiated samples (referred as γ-PLA) were left in the tubes for a week to get the radicals decayed completely before any measurements are done. For thermomechanical analysis (TMA), tensile strength was established in PLA and γ-PLA samples without or with an additional annealing step at 90°C. This means samples were heated to 90°C and instantaneously cooled at -40°C in liquid N2 before again raising the temperature of TMA study.
Another PLA blend is with polyglycolic acid (Wang, Wu, Lujan-Upton, Donahue & Siddiqui, 1997). The PLGA oligomers were synthesized directly by condensing lactic acid with glycolic acid at different ratios. Antimony oxide (Sn2O3) was used as catalyst (see above). The mixture of the two acids was then heated to 120°C. By distillation water was removed which got collected in the receiving chamber. The temperature was then elevated to 180-220°C under vacuum at 5 mm Hg. The system was to be kept at these conditions for ca. 5 h. This results in condensation polymerization. Water produced in the reaction was removed by distillation as above and the viscous oligomer solution was poured on aluminium foil and cooled at -5°C. The film thus produced was ground into small pieces.
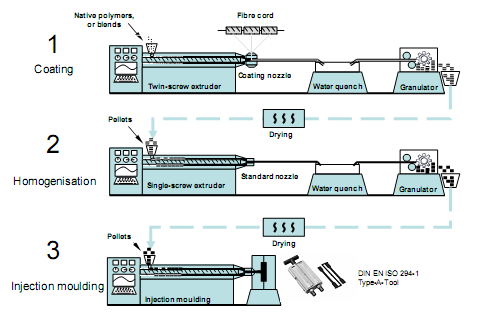
Among other blends is PLA-Thermoplastic starch (TPS) (MIhai, Huneault, Favis & Li, 2007). For this PLA 2002D (96% L- and 4% D-lactic acid PDLLA) was blended with TPS30 in presence of meleic anhydride as cross-linking agent using Leistritz 34 mm thin screw extruder (Fig. 4.1). Cornstarch was introduced with 30% glycerol (plasticizer) in extruder kept at 150 rpm and at ~70°C. After starch gelatinization, temperature was raised to 110-195°C to evaporate water and for plasticization under CO2 environment. Now PLA 2002D was pumped at high temperature and upon applying pressure at 165°C the blend was forced to come out as sheet, which was then dried in an oven at 50°C.

PLA 4032D was blended with natural cellulose fibers to enhance elastic modulus and tensile strength in PLA-cellulose composites. Abaca (banana fiber, Manila hemp; diameter 150 µm) and any man-made cellulose fiber (diameter ca. 12 µm) can be used to make such reinforced material (Bledzki, Jaszkiewich & Scherzer, 2009). Usually the so-called “green” composites are by weight 70% 4032D and 30% cellulose fiber.
The polymer and the fibers were extruded by twin screw extruder at high temperature 150-200°C and under CO2 environment, subsequently cooled down to ambient in water and then cut in to 15 mm pellets (Fig. 4.2). In the second step, these pellets were melted (150-180°C) and homogenized in single screw extruder. Finally the material in pellet form was molded using injection molder by bringing the temperature to 170-190°C and then molding were caste as per the requirement.
Crystalline Melting Point and Glass-Transition Temperature
According to Bikales (1971) the common basic parameter to test amorphous polymers is their glass-transition temperature (Tg). It will determine whether the material will be hard and solid or an elastomer in ambient to moderately high temperature ranges, and at what temperatures the behavior pattern would change. Tg is also important in partially crystalline polymers since it is readily gives an indication of embrittlement temperature.
The crystalline melting point (Tm) in partially crystalline polymer is an index of temperature at which the last traces of crystallinity disappears under equilibrium conditions. Differential thermal analysis (DTA) is often applicable for Tm and Tg measurements. These are important indices for determining whether an unknown polymer is a homo- or heteropolymer because any impurity or mixture which affects the above stated thermal properties by invariably changing particularly the Tg. In glass transition the magnitude of heat capacity changes from the baseline is generally much smaller than that of thermogram peaks resulting from latent heats like Tm.
Based on chemical nature of bonds, Tg in various polymers has already been calculated for referencing. For example, it is 45-50°C for polyamides, 60-70°C for polyesters (PLA included) and nearly -40°C for cross-linked polyurethane. Likewise, Tm values are also highly characteristic of the type of polymers and usually for any co-polymerization more than one peak is obtained corresponding to Tm of each polymer components. Differential Scanning Calorimetry (DSC) is the most appropriate method for the thermal measurements of different polymers. The instrument measures heat absorbed or released during heating or cooling of the samples. An outlay of the device is shown in Fig. 4.3.
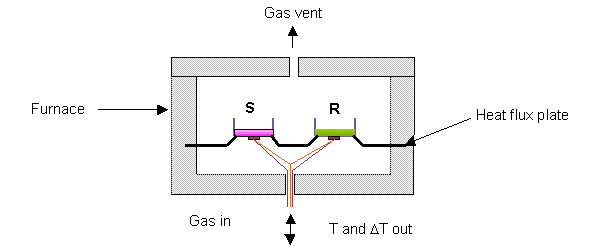
It records the difference in the amount of heat of a sample and reference with increasing the temperature in two sealed pans. Most DSC instruments are heat-flux design, and there is another type of instrument, “power-compensated DSC” and both of them gives equivalent results in most practical applications. Prior to start the samples are advised to be heated from room temperature to 200°C at 20<°C min-1 increment and held at 200°C for about 5 min to remove the thermal history.
The samples are then rapidly quenched at a rate ca. 500°C min-1 to -30°C. As in the figure, such thermally equilibrated samples are put in “S” pan, and reference material is placed in “R” pan. Small, flat samples are contained in two shallow pans, with the aim of making a good thermal contact between sample, pan and heat flux plate. Heat flux plate heats the pans and the conditions are controlled by a computer. A gas flow through the cell is provided to sweep away volatiles and create the required atmosphere. Normally the typical purge gas is air or nitrogen. Indium metal (Tg = 156.6°C) and polyethylene oxide (Tg = 66.2°C) are commonly used as upper and lower standards.
In the present DSC experiment small size of PLA 2002D pellets (ca. 50 mg) after thermal history removal (see above) was placed in “S” pan and above references in “R” pan. Temperature was set to increase at rate 5°C or 10°C min-1 from ambient to a temperature about 10°C to 25°C above melting point of the test sample (ca. 200°C). Upon giving heat flux, the output scan of DSC is recorded as temperature (°C) versus heat absorbed/released (endo- or exothermic reactions) as dH/dt in mJ/s. Studying synthetic PLA products, we would expect Tg at around 60°C and Tm at ~151°C as per the standard values (Dutkiewicz, Grochowska-Lapiensis & Tomaszewski, 2003).
Thermogravimetric analysis
TGA is associated complementary method suitable for studying polymer degradation studies (Bikales, 1971). The dry sample weight is measured as the reaction temperature is modified by way of a programmed rate of heating. Another modification is isothermal measurement, in which polymer is kept for a certain period at a constant temperature above the Tm, generally already pre-determined from DTA, and then at isotherm the weight difference is calculated within a fixed period. The TGA recording instrument, thermobalance, can be hooked to DSC and more-or-less same procedure is adopted, but instead of recording difference in heat flow, weight loss is measured.
For measurements, a pre-weight sample is placed on a crucible suspended in a precision balance. A linear variable differential transformer actuates the balance as the weight changes during heating. The corresponding electrical signal is amplified as output. The temperature using DSC can be ranged from ambient to 1000°C under an appropriate atmosphere of air or N2, and can be operated in vacuum. For obtaining a thermogram heating rates and increments can be chosen. Records of weight loss versus temperature or time at isotherms give different thermograms. For most polymers, TGA curves follow a simple sigmoidal path.
It starts gradually as reaction begins, subsequently decreases more rapidly within narrower range of temperature and finally leaves off as the reactants are spent or volatilize. Thermal stability can be obtained for a material by holding the polymer at high temperature for 20 min to deduce the extent of weight loss. It is suggested that polymers which volatilize <600°C thermal stability can be estimated by heating for 30 min at equivalent temperatures and by recording weight loss. Alternatively, temperature (TR) at which 50% of the weight of given polymer is vaporized under pyrolysis condition is another in index to determine stability. Temperatures at which maximum degradation takes place and the rate (mg/min) at which the polymer is vaporizing at the highest temperature are the other criteria to measure stability.
In the present TGA, 5 mg of the experiment material after clearing the thermal history were heated at rate of 20°C min-1 from 23°C to 500°C or at given temperature range in N2, O2 or any given atmosphere including vacuum. The dynamic thermograms are plotted to determine minimum and maximum degradation temperatures and pattern of decay.
Thermomechanical analysis
Thermomechanometry is a technique in which change in a dimension (length/volume) or any other mechanical property like tensile strength is measured as a function of change in temperature. Sample is placed in a quartz sample holder and a quartz probe with varying tip geometry is place right on the sample such that it stays in constant contact. A finite weight is applied on the probe. The entire assembly is then placed vertically in a furnace. With change in temperature the vertical movement of quartz probe represents expansion/contraction of the sample as a function of graded temperature. An outlay of the device is shown in Fig. 4.4.
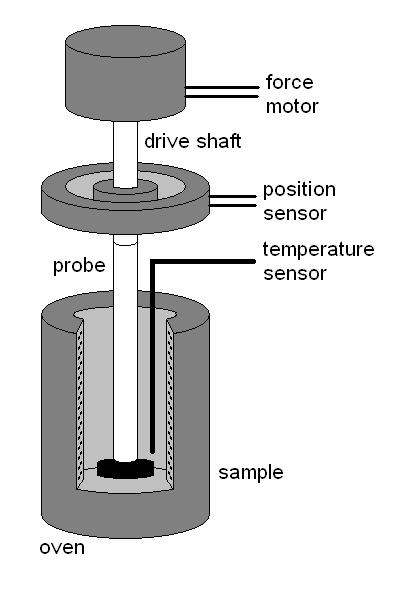
From recording probe displacement one can analyze thermal expansion coefficients, softening temperature and/or glass transition temperature. Thermal expansion coefficient (α) = [(dL or dV) / dt] / Lo or Vo, where Lo/Vo is initial and dL/dV is change in length/volume as the case may be and dt is time for this. While mostly applied for temperature stable materials like plastic and metal, this technique is less commonly used for PLA and other degradable polymers. More recently, for those PLA and other blends in which cross-linking is intensified by physical or chemical methods, resulting in more thermotolerant polymers are tested by this method (Nugroho & Mitomo, 2008).
In typical experiments polymer sheets of 2 mm width, 5 mm length and 0.1 mm thickness are heated under N2 atmosphere from 25°C to 200°C, under fixed load of 10 g and heating rate of 10°C min-1. For determining thermostability same polymers film samples (0.3 × 2) cm2 area and 0.02 cm thickness are heated from 90°C to 160°C. The strips are suspended in oven with a load of 5 and 10 g. The deformation and time required for break (tensile strength) are recorded.
Spectroscopic analyses
For elucidating the chemical property of a given polymer usually two methods are applied, namely the proton nuclear magnetic resonance (1H-NMR) and infra-red (IR) spectroscopy.
1H-NMR
Proton is an example of a nucleus which possesses magnetic momentum. When placed in an external magnetic field Ho, it can occupy two energy states, either aligned to its own magnetic momentum µ or against the field. The difference in energy of two states can be defined as ΔE = hvo = 2 µHo, where vo is frequency of resonant radio-frequency causing transition between the energy states and ΔE is the energy absorbed for excitation of protons from lower to higher state (Bikales, 1971). To simplify, let us consider collection of protons (water or benzene) in a tube and a radio-frequency of 60-100 Me/sec is applied by a coil wrapped around the sample and excited by an oscillator.
The magnetic field in a direction perpendicular to the axis of coil is applied and accelerated using a sweep coil. At a defined magnetic field resonance occur and energy of radio-frequency is absorbed by the protons to reach excited state and this absorbed frequency recorded. Theoretically all protons should have same Ho value and can be recorded as identical radio-frequency quenching as chemical shift (δ, in ppm), but in practice this does not happen. Depending on chemical binding and position of the protons different values of Ho is obtained which ranges on the order of 10 ppm. Protons attached to electronegative groups/atoms like –OR, -OH, -OCOR, halogen etc. remained partially “shielded”, and protons removed from such groups have higher Ho and higher chemical shift.
As PLA and blended polymers are repeated units of same groups, the signals of proton chemical shifts are highly characteristic of chemical constituents. Different repeat units give different diagnosable chemical shift signals. For PLA analysis, the oligomer samples are dissolved (final conc. 10% w/v) in deuterated chloroform with tetramethyl silane (TMS) as internal standard (Wang, Wu, Lujan-Upton, Donahue & Siddiqui, 1997).
Fournier Transformed IR (FT-IR)
In the electromagnetic wave range, IR is of high wavelength and low frequency (1-500 µ), means low energy. This energy is sufficient to affect not the atomic structure but the bonds between different atoms in a molecule. Mostly two kinds of vibrations occur in such covalent bonds, bending and stretching. IR is absorbed to change these vibrations. IR signals are highly characteristic of the functional groups present in the molecule and provide information on structure of the compound. Polymer molecules contain a number of atoms but their IR spectra are relatively simple. This is because they are linear or branched sequence or repeating units and thus despite large molecular weight the functional groups are fewer. The signals of repeating units overlap and give one or few very close absorption signal(s).
Samples of polymers are prepared in solutions using a variety of solvents, but can also be taken as films. In solid phase films/finely sectioned pallets are squeezed between pellets of potassium bromide, thallium bromide or silver chloride for which IR is permeable. For PLA analysis, oligomer samples in any appropriate organic solvent like acetonitrile were directly applied and cast on KBr crystals (Wang, Wu, Lujan-Upton, Donahue & Siddiqui, 1997).
Molecular weight determination by titration and end group analysis
The principle of the method as indicated by Wang, Wu, Lujan-Upton, Donahue & Siddiqui (1997) is to quantify the carboxylic group (-COOH) in PLA and blends by titrating the solution with an alkali of known strength. The PLA ground pellets, finely cut films are first dissolved in benzyl alcohol to final concentration 2% (w/v). This solution (25 ml) was titrated using 0.5 M benzyl alcohol solution of potassium hydroxide (KOH). For indication of end point few drops of 1% phenolphthalein in benzyl alcohol was added. For reference purpose pure benzyl alcohol with KOH and phenolphthalein was used for titration. The volume of alkali solution used for titration was calculated for determining average molecular weight (Mn) of the polymer using the following formula:
Mn = W / [C × (V – Vo)], where W is weight of PLA material to be titrated, C is concentration of KOH and V and Vo are the volume of KOH solution used for titration of PLA solution and the reference, respectively.
Solution viscosity measurements
Using any appropriate viscometer, the intrinsic viscosity (η) of a series of dilute solutions (10-3 -10-2 g ml-1) of PLA sample in chloroform was compared at 30°C with that of solvent (ηo) by adopting following equation:
ηsp/C = (η – ηo) / ηoC, where ηsp is specific viscosity that is equal to (ηr – 1), and is the ratio of flowing time of oligomer solution (t) to solvent, chloroform (to) through two marks in viscometer and C is concentration of oligomer solution. The intrinsic viscosity by Mark-Houwink equation is linked with the molecular weight as follows:
(ηo) = K Mnα, where Mn is molecular weight and K and α are two constants. At higher molecular weight for PLA and chloroform, standard K ranges from 3.02 × 10⁻⁵ to 6.06 × 10⁻⁴, and α varies from 0.64 – 0.94.A good correlation between intrinsic viscosity and molecular weight can be obtained from a calibration curve (Wang, Wu, Lujan-Upton, Donahue & Siddiqui, 1997).
Biodegradability analysis
PLA and the blends also spontaneously hydrolyzed from the acids generated through autolysis by initial hydrolytic cleavages of the ester bonds. Assessment of hydrolysis is carried out by loss of weight of the material or by decrease in molecular weight (Mn) of the oligomers generated from the polymer hydrolysis. Most of the biodegradability test of PLA is tested after a prior treatment of PLA at temperatures above the Tg and by incubating the substrates at relatively high humidity conditions. DSG analysis is also carried out to evaluate modification (reduction) in Tg values as a result of breakdown of cross-linking bonds. For this, two thermal scans are necessary each at 10°C min-1 rate, first at ambient temperature to 200°C to eliminate material’s thermal history and then from 0°C to 200°C for recording DSC scan (the method is already described).
According to Moran, Pazzano & Bonassar (2003) and Wang & Wu (1997), PLA and blend’s biodegradation can be studied under in vitro conditions. For this, 500 mg of ground pellet of PLA or blends is divided in 10 equal portions and each dispensed in 200 mM phosphate buffer saline (PBS), pH 7.4. The tubes were kept at 37°C and every 3-4 days up to eight weeks the solid samples are removed and lyophilized for 12 h to remove moisture and weighed to a fraction to minimum, 0.0001 g. Under non-constant pH, distilled water was used instead of PBS. At the time of sampling the pH of the water in tubes was measured because degradation of PLA would yield acidic pH owing to release of lactic acid. Assuming the hydrolytic degradation process being first-order reaction the following formula is used for degradable kinetics:
Weight loss (mg) = Wo – Wr, where Wo and Wr are the original and the remaining weight of the polymer at respective time intervals. For PLA there has been a modification done in the assay system: variation in temperature and relative humidity (RH). At temperatures above Tg and at high RH, degradation rates increase due to water absorption. The swelling concentration of water in PLA can be calculated from an empirical formula based on RH conditions as shown below (Karl-Fisher’s equation):
Water (ppm) = 40.6 RH(%) + 6.6 × 10⁻⁷ RH(%)
The combined effect of temperature and RH can be assayed at t = 40°C to 80°C and at RH 40% to 80% in humidity chamber.
Microbial and Enzymatic degradability analysis
The degradation of PLA is facilitated by those microbes and enzymes which hydrolyze the lactic acid ester bonds. For this a microbial consortium or a compost is included in the spontaneous degradation assay system and incubated as recommended by (ISO/CEN; European standard) as 58°C is kept for 45 days and (ASTM; American standard) whereby in day 1, 35°C; days 2–5, 58°C; days 6–28, 50°C, and days 28–45, 35°C is maintained (Gattin, Copinet, Bertrand & Couturier, 2002).
The PLA or blends cut into small pieces or ground were placed in a liquid medium or packing material was piled in compost and soil. Compost or microbial consortium equivalent to 1% volume was added. In liquid incubation air was bubbled through the medium at 0.5 L min-1. This gives an equivalence of oxygen to 6%. The percentage of material’s carbon converting to CO2 (percentage mineralization; Cg) can be calculated from following formula:
Cg (%) = 100 × (nCO2e – nCO2t) / nCO2th, where CO2th is the theoretical amount of CO2 in moles possibly can be available from the material. This can be theoretically calculated from an estimate of total –COOH groups present in the PLA or blend by end group analysis. The nCO2e and nCO2t are the amounts of net CO2 produced in assay and control test liquid media. The gas phase from above the medium can be passed through 1 N KOH solution and displacement of liquid due to absorption of CO2 is a parameter to calculate molar concentration of CO2 in gas phase. Control sets were those in which microorganisms were added but PLA or blend was omitted, whereas assay sets had both polymer and microorganisms.
If the Cg value comes out to be less than 0.01% the experiment was discarded. About 15 ml was periodically taken out to measure the degraded organic matter and biomass. For this samples were centrifuged for 20 min at 1,000 rpm at 4°C and the supernatant was passed through a cellulose acetate membrane filter of 0.2 µm pore size. The filtrate is used for dissolved organic carbon (DOC) measurement (Cs) using any standard total organic carbon analyzer (CHN analyzer). Prior to analysis inorganic carbon (carbonates) should be discharged in to CO2 by acidification. The residue in the combined supernatant and filtrate was used for biomass (Cb) estimation by dry matter technique. In this method the biomass residue is air-dried at 105°C until constant weight and difference in assay and control samples was recorded. Carbon balance (Cd) means the carbonaceous fraction of the degraded products, which is represented as:
Cd = Cg + Cb + Cs
Biodegradation percentage is defined as sum of mineralization (Cg) and bio-assimilation (Cb) percentages.
The enzymatic degradability analysis is carried out in presence of an enzyme Protenase K (Nugroho & Mitomo, 2008).Alternatively, a new enzyme, known as Cutinase-like enzyme from yeast, Cryptococcus strain S-2 has been used for hydrolysis of PLA (Masaki, Kamini, Ikeda & Iefuji, 2005). The hydrolysis is carried out in 67 mM of phosphate buffer, pH 7.4. Protenase K enzyme (0.8 – 400 µg ml-1) was dissolved in 1 ml of the buffer and 10 ml of PLA powder wrapped in steel mesh was suspended in the buffer. The incubation period could be varying but temperature was kept at 37°C. Towards the end of the assay, sample was taken out, washed with distilled water and methanol and dried under vacuum until constant weight and weighed. The following formula can be applied to evaluate degree of biodegradability:
Weight loss (%) = 100 × (Wo – W1)/Wo, where Wo and W1 are the weight of the sample before and after enzymatic treatment.
Effect of catalysts on DSC results of processed PDLLA
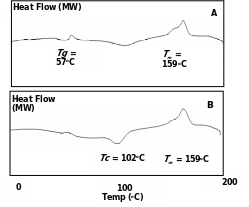
PLLA is a crystalline polymer and blending with DLA or meso-LA enables bringing amorphous property to PLA. In melt/solid polycondensation two catalysts are employed, SnCl2/PTSA or Sb2O3. These catalysts affect various thermal and degradation properties pf PDLLA. Since 2002D is thermally and mechanically processed PDLLA, the influence of the catalyst was examined on the final products originating from two catalyst-based reactions. The thermal analysis (DSC) of the two products catalyzed each by SnCl2/PTSA and Sb2O3 was carried out in temperature range of 0°C -200°C at a heating rate of 10°C min-1 under N2 environment.
Fig. 5.1 A & B shows thermograms of the two products. The DSC traces revealed presence of exothermic Tg peak at ca. 55°C and Tm peak at 157°C in case of PDLLA synthesized with Sb2O3. On the other hand, Tg was diminished and a new endothermic peak at 99°C appeared corresponding to Tc (crystalline temperature) with usual melting temperature with SnCl2/PTSA. PLLA is crystalline, stiff, opaque and less biodegradable, whereas PDLLA is transparent, amorphous fast in degradation and elastic. By changing the catalysts it is possible to gradually increase the crystalline property in PDLLA itself. PLLA and PDLLA processing was attempted with the two catalysts and their molecular weighs were compared.
As shown in Fig. 5.2 A, extending the polycondensation period up to 25 h in presence of SnCl2/PTSA catalyst produced high molecular weight polymer only in case of PLLA but not PDLLA. Here PLLA molecular weight increased linearly up to 8 × 10⁴ g/mol as against only 2 × 10⁴ g/mol for PDLLA. On the other hand, within the similar incubation period, Sb2O3 catalyst produced higher molecular weight PDLLA (up to 6 × 10⁴ g/mol compared to PLLA (4 × 10⁴ g/mol) (Fig. 5.2 B).

DSC results of PLA 2002D
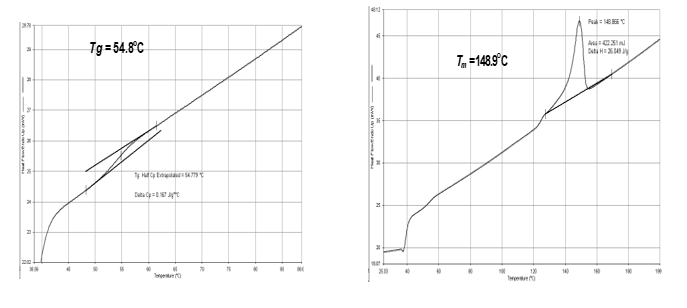
Commercially available PLA (2002D; PDLLA pellets) was subjected to DSC and the traces are presented in Fig. 5.3 A and B. In the curves there were two deviations in the thermal energies: one inconspicuous minor peak at 54.8°C which corresponded to Tg with ΔH = 0.167 J/g, and the other major peak at 148.9°C which corresponded to Tm with ΔH = 26 J/g with a shoulder at 127°C. There was no peak relative to the crystalline temperature, Tc, suggesting that the material is apparently amorphous in nature.
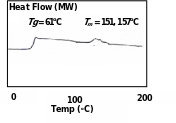
The Tm value corresponded to the factual figures of different PLA products as presented in Table 3.1 (Literature Review); 4.1 (Methodology) but the Tg value was lower than the standard PLA. From an available DSC records of 2002D (Fig. 5.4) (Byrne et al. 2007), which exhibited midpoint Tg at 61°C and two small Tm overlapping peaks at 151°C and 157°C, the present product of same nature and source gave lesser values.
When DSC results of this PDLLA product was compared with the other equivalent product from melt/solid polycondensation in presence of SnCl2/PTSA catalyst (Fig. 5.1 B), it was revealed that the polycondensation resulted in appearance of crystalline nature (appearance of Tc) in otherwise amorphous PDLLA. 200D was therefore comparable to the PDLLA from polycondensation in presence of Sb2O3 catalyst (with peaks at Tg and Tm and not at Tc) (Fig. 5.1 A).
DSC results of Thermoplastic starch-PLA 2002D blends
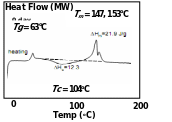
Thermostable starch-2002D blend, whose preparation using PLA: chemically modified plasticized starch (CMPS) at ratios from 90:10 to 20:80 (w/w) is described in methods section, has improvised thermostability and superior crystalline features (Jo et al. 2006). The thermal properties of different blends of 2002D: CMPS is shown in Table 5.1. As control, the extruded pure PLA 2002D exhibited Tg (61°C) and Tm (154°C) values as described before. There was no Tc detected because 2002D itself is a PLA blend (PDLLA; 2-4% D-LA in L-LA). For rapid determining the degree of crystallinity in PLLA and blended products the following formula is applied:
Crystallinity (%) = [(ΔHm – ΔHc)/ 93.1] × 100, where ΔHm is heat of fusion corresponding to Tm and ΔHc is heat of crystallinity corresponding to the Tc, both recorded as J/g. The
DSC curves are therefore used to determine the degree of crystallinity. In case of 2002D, ΔHc is negligible or insignificant because there was no peak corresponding to temperature of crystallinity. However, Tg kept changing upon mixing the CMPS. At lower CMPS content there was only one peak of Tg, which got split in to two peaks as the concentration of CMPS in the blend increased. Additionally, Tc peak started to appear in the DSC thermograms of the TPS blends and at lower CMPS the degree of crystallinity was very high. However, as the concentration of CMPS increased the blend became less crystalline and more amorphous clearly seen by decrease in degree of crystallinity. One representative DSC trace of PLA-CMPS blend is shown in Fig. 5.5.
Table 5.1 Thermal properties of PLA-CMPS blends.
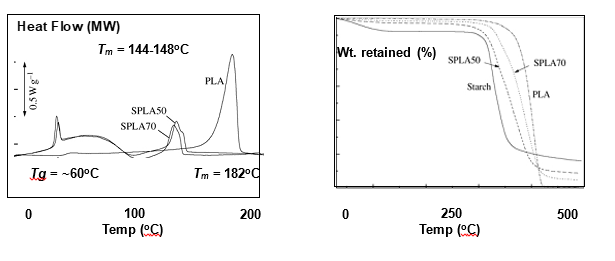
There are other blends of starch and PLLA as well, and two of them, SPLA50 and SPLA70 comprise 50 and 70% starch respectively. However, this is granulated starch and is not processed through glycerol plasticizers as the PLA-CMPS blends are (Mano, Koniarova & Reis, 2003). The DSC trance of these products and PLA used in blending are shown in Fig. 5.6. Surprising, the Tm at 182°C was much higher than the reported amorphous PDLLA values, and there was no detectable Tg. In comparison, SPLA 50 and SPLA70 not only exhibited sharply reduced ΔHm values, the Tm was also quite lower to 143.9°C and 147.9°C, respectively, than pure PLLA. Incidentally, there was no Tc peak as observed with PLA-CMPS blends. Hence, with different PLA and starch material the blends may show completely different thermal properties.
TGA results of starch-PLA blends
The TGA results of pure PLLA, starch and the starch blends, SPLA50 and SPLA70 are shown in Fig. 5.7. Native starch showed degradation step at 300-350°C. Native PLLA had degradation regime at 385-404°C. The two blends displayed degradation temperatures slightly higher than starch but lower to PLLA. The extent of degradation in the blends at a given temperature corresponded to the proportion of starch and PLLA in that material. For e.g. SPLA70 (higher starch) degraded at lower temperature compared to lower starch (SPLA50).
DSC and TGA results of “green” PLA-cellulose composites
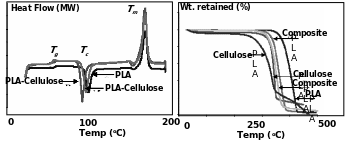
The various thermal properties of different grades of PLA-cellulose fiber composites were studied by Huda et al. (2004). For this composites of PLA 4032D and different quality and proportion of cellulose fibers were prepared and subjected to DSC analysis. DSC thermograms of such composites are presented in Fig. 5.8. The various indices like Tg, Tc, Tm, did not vary significantly in 4032D and different fiber composites but the values of ΔHm, ΔHc slightly increased.
Accordingly, the percentage crystallinity also increased in the cellulose fiber reinforcements compared to PLA alone. The TGA traces were also quite different in the composites when compared with 4032D. As depicted in Fig. 5.9, PLA degradation temperature was close to 425°C. For neat cellulose fibers the degradation temperature was much lower (i.e. between 350-360°C) and in some material the weight loss kinetics was in fact biphasic. In case of the cellulose-PLA composites, the degradation kinetics were invariably monophasic and the degradation temperatures were intermediate to cellulose and PLA (355-375°C).
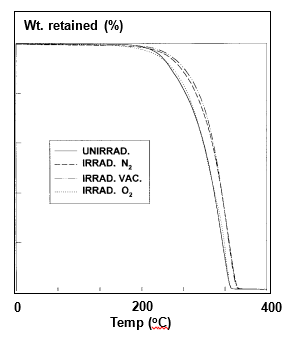
Effect of γ-radiolysis on TGA and TMA properties of γ-PLA
TGA measurements of untreated and γ-radiation treated PLLA samples were carried out and the traces are plotted as Fig. 5.10. The TGA analysis was carried out in N2 and O2 environments to distinguish oxidation related degradation at higher temperatures. The unexposed samples exhibited complete degradation at ca. 356°C. The degradation kinetics was not affected by presence or absence of any gas inside the ampoules. When irradiated, γ-PLA displayed somewhat thermal resistance and the weight loss was less at corresponding temperatures. The complete degradation occurred at 10-25°C higher temperature than non-irradiated PLA controls.
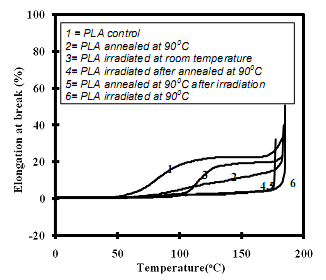
The TMA was carried out for untreated and γ-PLA samples as percentage elongation until break as a function of temperature. As shown in Fig. 5.11, control sample started to deform after glass temperature (~65°C). The samples annealed at 90°C before TMA did exhibit reduction in expansion but the effective temperature for deformation remained unaltered. γ-PLA irradiated at room temperature started to deform at higher temperature (105°C), but γ-PLA whether annealed or not irradiated at 90°C had remarkable tensile strength at high temperature. The deformation began at temperature at >175°C. Hence, γ-irradiation at high temperature (>Tg) made the γ-PLA mechanically stable at comparatively higher temperatures.
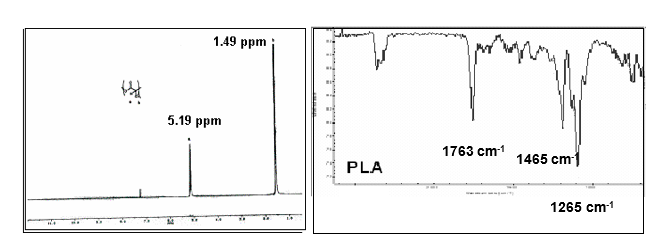
Spectral characteristics of PLA
FT-IR and 1H-NMR analyses of PLA was carried out to identify the signature signals representing specific functional groups associated with the polymers. Figure 5.12 represents the NMR spectrum of PLLA. The methane (-CH-) signal of the repeated chain of PLLA was quite characteristic and appeared at δ = 5.19. The peak at δ = 1.6 is highly characteristic of methyl group (-CH3) but is generally considered less valid for PLLA assessments (Wang, Wu, Lujan-Upton, Donahue & Siddiqui, 1997). The FT-IR of PLLA is presented in Fig. 5.13. The strongest peaks observed in the case of PLA were at 1753 (-C=O), 1465 (-CH-), 1362 and 1265 (-C-O-) (Wang, Wu, Lujan-Upton, Donahue & Siddiqui, 1997).
“Soft” Poly Lactic acid-Glycolic acid (PLGA) blends-thermograms
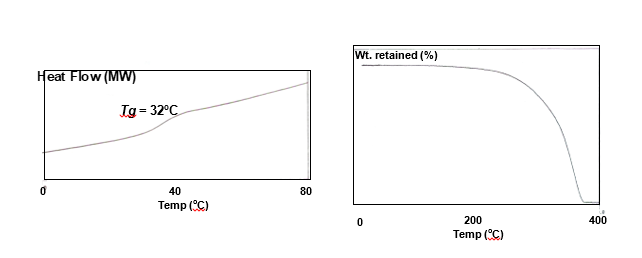
Neat PLA and PLA blended with glycolic acid (GA) at proportions 85:15, 72:28, 65:35 and 46:54 (by weight) were subjected to for DSC and TGA (Wang, Wu, Lujan-Upton, Donahue & Siddiqui, 1997). Various other tests confirmed that PLGA has no crystallinity and therefore as shown in Fig. 5.14, there was neither any melting temperature (Tm) nor crystalline temperature (Tc) peaks in the DSC traces. There was though a weak depression in the curves at ca. 32°C corresponding to its (PLGA 72:28) Tg. The results of glass transition temperature considerably varied depending of the proportion of GA and LA (varied between 20-32°C, but considerably lower than PLA, ~60°C). A TGA spectrum of PLGA 72:28 is presented in Fig. 5.15. It is a clean monophasic thermal degradation curve with onset of decomposition at 275°C and near completion at 350°C. These values are much lower than those of neat PLA.
Degradation of PLA – Molecular weight, DSC, TGA results
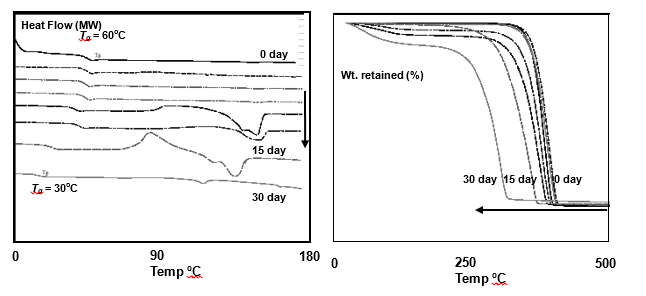
The periodic thermograms considerably vary during biodegradation process of PLA as recommended by ISO/CEN. An experiment was carried out in which different household material prepared from PLA 2002D (96% LLA and 4% DLA) was piled with compost and soil just above the ground (Kale, Auras & Singh, 2006). The initial pile temperature was ~65°C, RH ~63% and pH 8.5. At periodic intervals DSC scans of the material in 30 days incubation was taken and these traces were compiled in Fig. 5.16. The most notable result was that during first 4 days the initial Tg = 60°C slightly increased and after that it started to decline to approx. 30°C on 30th day.
The overall crystallinity increased in course of degradation as revealed from the apparent increase in Tc at the later stages of degradation. There were also additional peaks in course of degradation at 130 -150°C, which could not be explained. The Tm values were not conspicuous but from 150°C initially it increased to 155°C within 5 days and then it started to decline up to 110°C on 30th day. The decrease in Tg in compost followed a linear trend and this can be normalized as: Tg = Tg(0) + dt, where Tg(0) is glass transition temperature at zero time and d is reduction in Tg as a function of time, t. Degradation also follows a typical trend in TGA analysis which is presented in Fig. 5.17. At high temperatures the degradation would mark dehydrated thermal decomposition and lowering in molecular weight.
As can be seen, up to 15 days there was no marked difference in the TGA curves but between 15-30 days the decomposition temperature from about 385°C to 320°C. Here we find a direct relationship between losses of molecular weight (Mn) at high temperature versus the decrease in decomposition temperature (Td) as follows: Td = Td(infinity) – B/Mn, where Td(infinity) is Td at very high Mn and B is a constant term depending on the nature of PLA used.
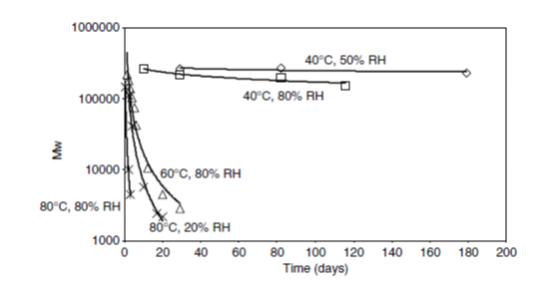
PLA 2002D degradation was also examined at different humidity and temperature conditions. According to Henton, Gruber, Lunt & Randall (2005), humidity intensifies the hydrolytic degradation resulting in rapid decrease in molecular weight. The rate of molecular weight loss followed two step kinetics, first occurring very fast (loss of mostly amorphous phase), and second occurring much slowly (loss of crystalline phase). The rate of hydrolysis markedly increased at temperature above Tg. Figure 5.18 depicts loss of molecular weight over a period of 200 days under different humidity and temperature conditions. It can be seen that below Tg, like at 40°C, there was hardly any degradation of PLA material, regardless of whatever the moisture content was. At or above Tg, the degradation was very rapid, initially fast and then slow rates and humidity markedly accelerated the degradation rates (for e.g. at 80°C, 80% RH was faster than 80°C, 80% RH).
Degradation of PLA – Carbon balance
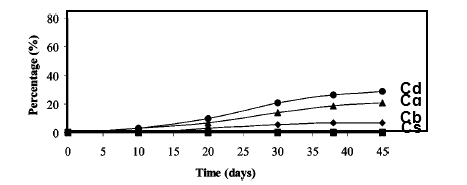
Microbial degradation of PLA either in compost or in solution (medium) is a process in which C of PLA gets transformed to biomass, total organic C and CO2. In an experiment using PLA based films and a culture medium as microbial source and by following ISO/CEN standards, the rationale of these carbon components as a function of time was evaluated (Gattin, Copinet, Bertrand & Couturier, 2002).
As shown in Fig. 5.19, within 45 days of incubation, total C-balance (Cd = Cg + Cb + Cs) was 30% including about 23% mineralization (Cg). There was no DOC within this period suggesting that microbes partially used PLA as C source and partially mineralized to CO2. There was also a lag period of 15 days before PLA started to mineralize/assimilated. As almost same time period is required for initial rapid degradation of PLA for transformation of high molecular weight to low molecular weight oligomers and as a result there is a fast kinetic reduction in molecular weight, apparently microbes might be utilizing only the oligomer components and not the processed polymer at all.
As there was also no presence of LA in the medium most likely LA was either not produced from oligomers or was utilized by the microbes. No clear C-balance was found in case of experiments in which ASTM standards were followed. It is therefore obvious that for microbial degradation high temperature throughout the incubation period is mandatory.
Enzymatic degradation of PLA
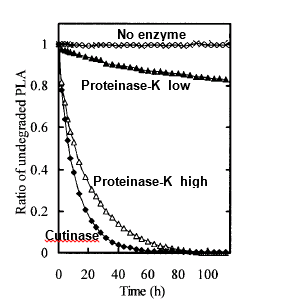
Proteinase K-dependent hydrolysis of PLA was carried out in PBS. The degradability was tested from ratio of un-degraded PLA (Masaki, Kamini, Ikeda & Iefuji, 2005). As presented in Fig. 5.20, enzyme at the low concentration (0.8 µg ml-1) degraded high molecular weight PLA by only maximum 20% but when used at higher concentration (400 µg ml-1), PLA was almost completely degraded within 88 hours. Another enzyme, called Cutinase-like enzyme from yeast, Cryptochoccus, at even lower concentration (0.8 µg ml-1) completely degraded PLA within 50 hours.
Degradation of γ-PLA and thermoplastic starch-PLA
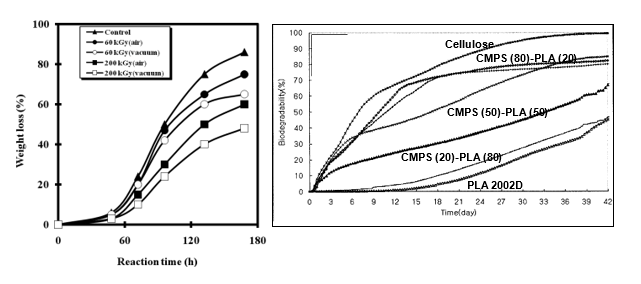
The modification due to irradiation or blending with thermoplastic starch considerably changes the physical and thermal properties of PLA. It was a matter of interest to evaluate to what extent the biodegradability in such polymers is affected from the basic material, PLA2002D. Two experiments were conducted one each for a polymer type. In the first experiment (Nugroho & Mitomo, 2008), PLA was irradiated using two intensities of γ-rays, i.e. 60 and 200 kGy for different period of time under vacuum or air and then these γ-PLA materials were subjected to proteinase-K mediate degradation as carried out above.
The weight loss against time was measured and as shown in Fig. 5.21, the curves were sigmoid. Degradation proceeded slowly up to 48 hours and then increased sharply between 48 and 130 hours. After that the degradation rates slowed down. The weight loss values at 60 kGy in air were 75% after treatment time of 168 hours, whereas within same time period in vacuum the loss was only 65%. The corresponding values for 200 kGy irradiation were respectively 60 and 50%. Oxidative chain scissions and less introduction of cross-linking could account for quicker loss of weight in air than under vacuum. The results demonstrate that degradation rates become slower when PLA was irradiated with higher dose of radiations.
In the second experiment, thermoplastic starch (CMPS)-200D PLA blends of different composition (proportions of starch and PLA) were kept in compost and by standards of ASTM the degradation of the blends, and neat 2002D and cellulose as reference material, were monitored against different time of incubation. As shown in Fig. 5.22, cellulose was about 84% degraded within 42 days. The blends were also degraded almost by same time period.
However, with PLA there was an initial lag period of 11 days and then the degradation commenced. The same trend was seen in blends in which CMPS proportion was less but as CMPS proportion started to increase the initial time lag decreased. Also the blends started to show faster degradation in early days compared to PLA alone. In neat PLA, microbial attack started only after lag period whereas in CMPS-PLA, the starch component started to degrade in the beginning which created holes for eventual accelerated degradation of PLA component.
Degradation kinetics of “soft” PLGA
Spontaneous solution degradation of PLGA blends at different proportions of GA and DLLA was carried out in PBS buffer at constant pH and in water at varying pH’s, and weight loss was plotted against time (Wang & Wu 1997). As shown in Fig. 5.23 (A & B), biodegradation was biphasic; in first phase there was not much weight loss. This can be considered as a lag phase required for water absorption, which differed in time length (PLGA 46:54 – 2 days and PLGA 72:28 – 6 days).
In the second phase, rapid degradation took place and different composition exhibited different degradation rates, the higher the GA composition, faster the degradation rate. The time kinetics of biodegradation did not vary significantly for PLGA blends at constant and variable pH, but the rates were higher at constant pH. As the pH lowers down during degradation process in un-buffered medium (variable pH condition), it is likely that acidic conditions [high H+] prevent hydrolytic breakdown of PLGA.
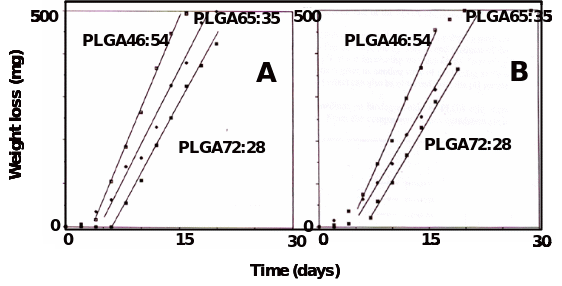
Discussion
The various thermal, mechanical, chemical and degradative properties of PLA and blends/composites have been evaluated in this work using standard procedures. During synthesis and after synthesis the thermal and mechanical properties can be improvised and two such examples have been highlighted. As most of the NatureWorks PLA is blends of PLLA and PDLA at different composition and processing conditions, it was a matter of interest to analyze whether synthesis conditions can modify the blend composition and molecular weight of the resultant PDLLA.
It was found that in Meld/Solid condensation process, under low pressure and at high temperatures, application of two different catalysts, SnCl2/PTSA or Sb2O3, considerably affected the composition of PDLLA. In DSC traces, crystallization was redundant in presence of Sb2O3 catalyst but not when SnCl2/PTSA was used. This means, the proportion of LLA in the later PDLLA blend was quite high (most likely > 99%) with respect to DLA than what could be found in case of SnCl2/PTSA (between 92-96%).
It is worth mentioning that starting with 50:50 mixtures of LLA and DLA, by changing catalysts, the composition of final product and thereby crystallinity, thermal and mechanical strength and degradability etc. can be easily modified. Molecular weight of the final product also greatly affects the crystalline behavior and therefore the catalyst’s effect was seen on PDLLA molecular weight. It was interesting to note that Sb2O3 polycondensation enhanced both DLA and LLA polymerization much over just LLA condensation, yielding greater proportion of PDLA content in the PDLLA blends which were more amorphous in nature. Conversely, SnCl2/PTSA polymerized LLA more than DLA and such PDLLA products had higher PLLA content and were more crystalline.
PLA 2002D tested in this study should be comparable to more amorphous PDLLA blend of Sb2O3 polycondensates with DLA content between 2-4%. Hence, we expected Tm and Tg peaks in the DSC thermogram but not Tc depression which is unique of PDLLA with negligible to < 1% or DLA. Indeed, we detected only these two peaks and the degree of crystallinity was calculated to be zero in this product.
However, our Tg value was lesser than standard 2002D and there was no apparent split in the Tm peak. Tg may vary in 2002D products depending on the extrusion conditions. The two apparently split Tm peaks could be the result of separate melting points of LLA and DLA in 2002D from the available records. This means that in the given (to us) 2002D is a more homogeneous preparation with higher cross-linking of DLA and LLA yielding a midpoint Tm value.
Another post-synthesis modification in PLA enabling superior thermal and mechanical performance is by way of γ-radiations. Radiolysis is believed to strengthen PLA by replacing side chain ester scissions with formation of saturated and unsaturated aliphatic side chains and aldehyde groups as end groups. LLA rich PLA already exhibit prominent depression close to 100°C attributed to crystalline temperature related changes. The ΔHc values towards Tm in PLA greatly increases with dose or time period of radiation due to above chemical changes in the polymer (Nugroho & Mitomo, 2008).
Higher enthalpy means harder and opaque material with superior thermal and mechanical properties. In was found that indeed this was the case with γ-PLA. First, the TMA revealed that neat PLA started to deform at temperatures just above glass transition temperature (~65°C). Room temperature irradiated PLA started to deform at greater temperature, most likely due to change in Tg. Annealing means a prior heat treatment and is a method to improvise crystallinity. All the samples that were annealed before or after irradiation exhibited much higher deformation temperatures.
The radiation and high temperature above Tg yielded PLA with maximum mechanical strength. Apparently, both radiation and annealing had common modification in scission bonds and resultant increase in degree of crystallinity, and this may in turn provide heat-sustaining tensile strength. The TGA also corroborated to the fact that γ-PLA had superior thermal stability to degradation than PLA. A shift the TGA curves towards higher temperatures revealed that radiolysis has removed those species that are responsible to initiate thermal degradation at lower temperatures.
The scission ester side chains are normally more susceptible to thermal breakdown and new saturated and unsaturated aliphatic side chains emerged from radiation may sustain premature initiation of any thermal degradation. Another explanation is that the hydroxyl end groups may be replaced with acetyl groups, which may shift degradation endotherm by 15-25°C. In this study the radiolysis-related endotherm shift was seen under vacuum or N2 and not O2 environment. Oxygen upon γ-irradiation produces hydroxyl radicals which prevent chemical modification in scission bonds and the end groups, required for thermal stability of γ-PLA.
A blend of PLA 2002D and chemically modified plasticized starch changed the amorphous property of 2002D. This is due to glycerol and to some extent CO2 which act as plasticizers for starch, and upon extrusion with PLA the blends start to show depression corresponding to crystallization temperature, Tc. The crystallization property is inherent from starch because as the starch proportion in blend increases the Tc also proportionately goes up. At higher starch concentration Tm peak splits in to two, suggesting that this is a hetero-polymer and both components maintain their separate thermal properties.
The Tg of PLA also changes as starch is blended, indicating that this is a heterogeneous mixture and are thermodynamically immiscible. Strangely, another grade of thermoplastic starch-PLA blend in which plasticizer items like glycerol were not mixed, exhibited completely different thermogram. Here, Tc was not discernable, apparently, due non-plasticized starch. But there was a backward shift of Tm from PLA and this was due to starch hydrolysis and loss of water and in the absence of plasticizers. Raw starch also produced a dehydration exotherm coinciding with Tm of starch-PLA blends. In TGA, native starch also show degradation in range of 300-350°C.
Blending with non-plasticized starch brought down the PLA’s decomposition temperatures. This change was expected as the blend was still heterogeneous and retained the thermal property of both starch and PLA. A more improvised composite is PLA-Hydroxypropyl etherified cassava starch (EST) (Liu et al. 2008). In this, different proportions of PLA and EST were initially mixed at high temperatures and chemically cross-linked by esterification using SnCl2 catalyst. PLA-EST was then extruded again at high temperature in sheets by single screw extruder. These biodegradable plastic films immensely reduce the cost of starch-PLA sheet and film production.
Another processed PLA 4032D-based product discussed in this work is biocomposites with two cellulose fibers. Because such fibers are prepared from complete natural products, they are called “green” composites. So far as elasticity modulus and other mechanical properties are concerned the composites exhibited many superior features (Huda et al. 2004). Thermal properties were also different from neat PLA. The Tg and Tm of the PLA did not significantly change with cellulose reinforcements and Tm temperature slightly lowered. More significantly the crystallization enthalpy (ΔHc) and melting enthalpy (ΔHm) increased with addition of cellulose.
Overall, there was slight increase in degree of crystallinity in the composites. This property would help in superior thermal resistance and reduced weight losses at degradation temperatures. To our surprise, this was not so. In TGA curves, the PLA-cellulose composites though had much better thermal stability compared to raw cellulose, its performance was not as good as PLA. It is likely that in the composites cellulose fiber dispersion during processing was not even. Thus, the product although exhibited good mechanical properties, did not present any substantial improvement in the thermal properties. A recent improvisation in this area is injection molded PLA with recyclable paper shopping bag fibers (Kramschuster et al. 2007). Composites of PLA 3001D and fibers reclaimed from waste shopping bags show good tensile strength and thermal stability, yet they are biodegradable.
Another material discussed in this work was PLGA. There were no melting or crystalline temperatures indicating amorphous nature of the product. The Tg values were lower than or close to the physiological temperature (37°C). Below the glass transition temperature a polymer occurs in rubbery state, in which matrix have high degree of water permeability relative to the glassy state that is above Tg. Higher water permeability results in faster hydration rate and higher degradation rate at relatively lower temperatures. This was revealed in the TGA curves of PLGA.
Degradation of PLA was accompanied with initially a marginal decrease followed by a sharp decline in Tg to almost 50% of initial values. Roughly, reduction of Tg took place at a rate of 0.97°C/day. It appears that this biphasic degradation relates to conversion of polymer into oligomers in first phase and oligomer degradation in second. The first phase seems to be spontaneous and is mainly carried out by the acids released from PLA itself. Acidic pH accelerates the hydrolysis of ester linkages and breakdown of long macromolecular chains. In the second phase microbial attack apparently mineralizes and assimilates the oligomers. Hydrolysis of PLA preferentially occurs in the amorphous region and overall crystallinity increases as degradation proceeds. Thermal decomposition occurs by de-polymerization and random degradation.
De-polymerization is accompanied by rapid reduction in polymer mass but slow reduction in molecular weight, whereas random degradation results in rapid loss of molecular weight and hardly any change in mass. Both processes occur at anhydrous conditions at relatively high temperature. A major variation in decomposition temperature takes place at the later stage of degradation, when molecular weight almost drops by over 65%. It is important to note that in composting condition temperature stays at > 60°C, RH at > 65% and pH ~8.5.
When contribution of degraded PLA C towards microbial biomass, dissolved organic C and mineralization was examined, it was found that C-balance was not more than 30%, that too mostly accounted from mineralization. This means microbial utilization of PLA depends on how much LA is released from auto-catalytic decomposition and most probably microbes are not capable to even utilize the oligomers. The spontaneous degradation in compost was accelerated by high temperatures (above Tg) and RH. Humidity has two roles to play. Firstly, it depresses the Tg and thereby enhance degradation at given temperature.
For high molecular weight PLA 7000 ppm of water depresses Tg by 11°C. Secondly, moisture enters primarily the amorphous part and slowly in the crystalline part. PLA hydration and swelling produces more hydrophilic acid and alcohol groups and accelerates hydrolysis.
Even though the crystallinity and thermal resistance seem to increase in CMPS-PLA blends, such polymers are faster degraded in compost compared to raw PLA. Starch is more hydrophilic than PLA and absorbs water more rapidly and hence accelerates auto-degradation of PLA. Subsequently, CMPS component starts to degrade much earlier creating holes for invasion of microorganisms to attack the blend. We do expect that biodegradation of cellulose-PLA composites should be also faster than raw PLA. Cellulose is a natural fiber and is degraded by microorganisms as a natural process in the compost.
Only a few enzymes from microorganisms are found to degrade PLA. Here we mention about two such enzymes from bacterium, Tritirachium album (Proteinase K) and yeast, Cryptococcus sp. (Cutinase like enzyme). Enzymatic degradation proceeds mainly through surface erosion mechanism and amorphous regions hydrolyze more readily than crystalline region. Both the microbes are not frequently found in composts or soils and there must be other soil-borne organisms, earthworms, insects taking part in decomposition. Enzymatic degradation of γ-PLA, especially when processed under vacuum, was strongly inhibited than PLA material.
Radiation induces scission, and cross-linking bonds might attribute to not only improved mechanical and thermal resistance but also reduced enzymatic hydrolysis. Besides, as explained for TGA curves, radiolysis may initiate new chain ends viz. acetylation that is not accessible to the enzymes. Presence of O2 during radiolysis may produce hydroxyl radicals thereby affecting such chemical modifications. PLGA due to non-crystalline nature and low thermal degradation temperatures is expected to degrade even in absence of any external enzyme. Partly this is due to more hydrophobic nature of PLGA, which enables faster hydration and spontaneous degradation.
At constant pH near neutrality, the rate of PLGA degradation was faster than at changing pH (drifting towards acidic pH). The H+ ions produced from GA and LA after initial hydrolysis lowers the pH to 2.0, and this seems to inhibit further auto-degradation of PLGA.
Conclusion
Two antagonistic issues always concern PLA-based polymer fabrications in packaging industry; biodegradability and cost-effectiveness vs. crystallinity and thermal and mechanical strength of the product. The crystallinity and molecular weight of PDLLA can be controlled by effectively and selectively blending L-, D- and meso-LA as source material, and by changing catalysts and monitoring Melt/Condensation period.
Further, thermo-mechanical parameters of raw PLA can also be improvised by γ-irradiation. PLA resins (typically PDLLA at different proportions) can be tailor-made for different fabrication process including injection molding, sheet extrusion, blow molding, thermoforming, film foaming and fiber spinning (Henton, Gruber, Lunt & Randall, 2005). The fundamental procedures are repeated heating at varying temperatures (118-200°C) in specialized molds like single or twin injectors etc. under atmosphere of N2 or CO2, in presence/absence of plasticizers and other cross-linking chemical agents, then compressed released of molten material in pellet, foam, sheet or fiber forms, followed by fast cooling to ambient or to sub-zero temperatures and drying of the material. Injection molding of heat-resistant PLA products require rapid crystallization rates that can be achieved with less than 1% D-isomer and addition of plasticizers.
The high degree of crystallinity increases melting temperatures and thermal resistance but biodegradability gets adversely affected. 3010D is one such product. Extrusion-thermoforming is optimized, for e.g. in case of 2002D, by adding 2-8% D-isomer that does not allow crystallization in melt process. Mechanical properties can be improvised by introducing a variety of branching methods like radiation. Fiber is another application product of PLA and can be obtained from melt spinning (e.g. 6700D). Binder fibers with low crystallinity are desired for ease in melting and adherence. To achieve this higher D-isomer (8-20%) is used. Biaxially oriented film like 4040D is obtained by introducing variable concentrations of D- and meso-isomers.
Here we have shown that PLA can be extruded with two natural composites, thermoplastic starch and cellulose fibers. In both blends/composites the thermal (and also tensile and other mechanical) properties improvised partially due to crystallinity developed during heat processing. The most advantage is that these products are highly biodegradable because the natural resources are susceptible to composting and/or microbial enzymatic hydrolysis. Further, such biocoposites of PLA are also cost effective. The other advantages are natural, soft feel, ease of processing stain and soil resistance, low smoke generation during burning, good ultraviolet resistance, easily dyeable, and bring good wickability and moisture to application.
Although PLA has been also combined with petroleum based synthetics and this has immensely improved the mechanical and thermal property, the disadvantages have been their toxicity and inability to biodegrade under compost conditions. Further research is desired to make PLA composites more homogeneous by evenly distribution of crystalline and amorphous portions and with uniform thermal and thermo-mechanical features. Microwavable products using natural composites would be another innovation in the future. Medical application in drug-delivery system, aerosols, recasting of cartilages and implants, slants etc. using PLGA seems to be another vital line of research with PLA products. Finally, with research and technological inputs it should be possible to replace petroleum resins by the products of agricultural recyclable wastes for future packaging industries.
References
Babanalbandi, A., Hill, D.J.T. & Hunter, D.S. & Kettle, L. (1999). Thermal stability of poly(lactic acid) before and after γ-radiolysis. Polymer International, 48, 980-984.
Bikales, N.M. (1971). Characterization of Polymers. Livingston (NJ): John Wiley & Sons Inc.
Bledzki, A.K., Jaszkiewicz, A. & Scherzer, D. (2009). Mechanical properties of PLA composites with man-made cellulose and abaca fibres. Composites Part A: Applied Science and Manufacturing, 40(4), 404-412.
Byrne, F., Ward, P.G., Hughes, D., Cullen, J. & Dowling, D.P. (2007). Comparative Study of the Processing Conditions Required for PLA and PET Polymers. Proceedings of the IMF Conference, Waterford Institute of Technology. Web.
Dutkiewicz, S., Grochowska-Lapiensis, D. & Tomaszewski, W. (2003). Synthesis of Poly(L(+) Lactic Acid) by Polycondensation Method in Solution. Fibers & Textile in Eastern Europe, 11(4), 66-70.
Essawy, H.A., Helaly, F.M. & Shabana, M.A. (2007). Synthesis of Poly(lactide) Blends by Melt/Solid Polycondensation. Journal of Elastomers and Plastics, 39, 303-306.
Gattin, R., Copinet, A., Bertrand, C. & Couturier, Y. (2002). Comparative Biodegradation Study of Starch- and Polylactic Acid–Based Materials. Journal of Polymers and the Environment, 9(1), 11-17.
Kale, G., Auras, R. & Singh, S.P. (2006). Comparison of the Degradability of Poly(lactide) Packages in Composting and Ambient Exposure Conditions. Packaging Technology and Science. Web.
Henton, D.E., Gruber, P., Lunt, J. & Randall, J. (2005). Polylactic Acid Technology. In: Natural Fibers, Biopolymers, and Biocomposites (pp. 528-577). Boca Raton, FL: CRC Press Taylor & Francis Group.
Huda, M.S., Mohanty, A.K., Misra, D.M. & Schut, E.(2004). Physico-mechanical Properties of Green Composites from Polylactic Acid (PLA) and Cellulose Fibers. Proceedings of 10th Annual Global Plastics Environmental Conference (GPEC 2004), Detroit, MI, Paper # 11. Web.
Jo, G.S., Shin. B.Y., Lee, S., Cho, S., Jang, S.H., Cho, B.H., Hong, K.H., Kim, B.S., Kang, K.S., Jang, W.Y.(2006). Mechanical Properties and Biodegrdation Studies on Blends of PLA and Chemically Modified Plasticized Starch. Applied Chemistry, 10(2), 405-408.
Kramschuster, A., Pilla, S., Gong, S., Chandra, A. & Turng, L-S.(2007). Injection Molded Solid and Microcellular Polylactide Componded with Recycled Paper Shopping Bag Fibers. International Polymer Processing XXII(5), 436-445.
Liu, X., Zhao, N., Yang, K., Wang, Y., Zheng, C., Li, S. & Zhang, Z. (2008). Preparation of Poly (lactic acid)/Etherified Starch Composites. Iranian Polymer Journal 17(12), 947-952.
Masaki, K., Kamini, N.R., Ikeda, H & Iefuji, H. (2005). Cutinase-Like Enzyme from the Yeast Cryptococcus sp. Strain S-2 Hydrolyzes Polylactic Acid and Other Biodegradable Plastics. Applied and Environmental Microbiology, 71(11), 7548–7550.
Mano, J.F., Koniarova, D. & Reis, R.L. (2003). Thermal properties of thermoplastic starch/synthetic polymer blends with potential biomedical applications. Journal of Materials Science: Materials in Medicine, 14, 127-135.
Mihai, M., Huneault, M.A., Favis, B.D. & Li, H. (2007). Extrusion Foaming of Semi-Crystalline PLA and PLA/Thermoplastic Starch Blends. Macromolecular Bioscience 7(7), 907-920.
Moran, J.M., Pazzano, D. & Bonassar, L.J. (2003). Characterization of Polylactic Acid–Polyglycolic Acid Composites for Cartilage Tissue Engineering. Tissue Engineering, 9(1), 63-70.
Nugroho, P. & Mitomo, H. (2008). Study of Biodegradation and Improvement of Heat Stability of Poly(lactic acid) by Irradiation at High Temperature. Malaysian Polymer Journal, 3(1), 27-37.
Wang, N., Wu, X.H., Lujan-Upton, H., Donahue, E. & Siddiqui, A.(1997). Synthesis, characterization, biodegradation, and drug delivery application of biodegradable lactic/glycolic acid oligomers: Part I. Synthesis and characterization. Journal of Biomaterials Science Polymer Edition, 8(12), 905-917.
Wang, N. & Wu, X.S.(1997). Synthesis, characterization, biodegradation, and drug delivery application of biodegradable lactic/glycolic acid oligomers: Part II. Biodegradation and drug delivery application. Journal of Biomaterials Science Polymer Edition, 9(1), 75-87.