Introduction
BT (British Telecom) Group plc is one of the oldest providers of telecommunications services in the world. Its mother companies were the National Telephone Company (NTC) and the General Post Office (GPO). GPO took over telephone business from NTC in 1912. The company offered monopoly telephone services in the UK. In 1965 the Postmaster General proposed that GPO be converted from a monopoly to a nationalized entity. Lord Wolmer had raised the same request in 1932 in one of his books. Therefore, in 1980 British Telecom was created. This meant that there was competition in the UK’s telecommunications industry. BT was later sold to private investors in 1982 when the government sold part of the company’s shares. The percentage sold was 51 percent. More than 50 percent of the company’s shares were also sold to the public in 1984. This meant that the company lost its monopolistic power and entered into the perfect competition market (Arnold, 2008).
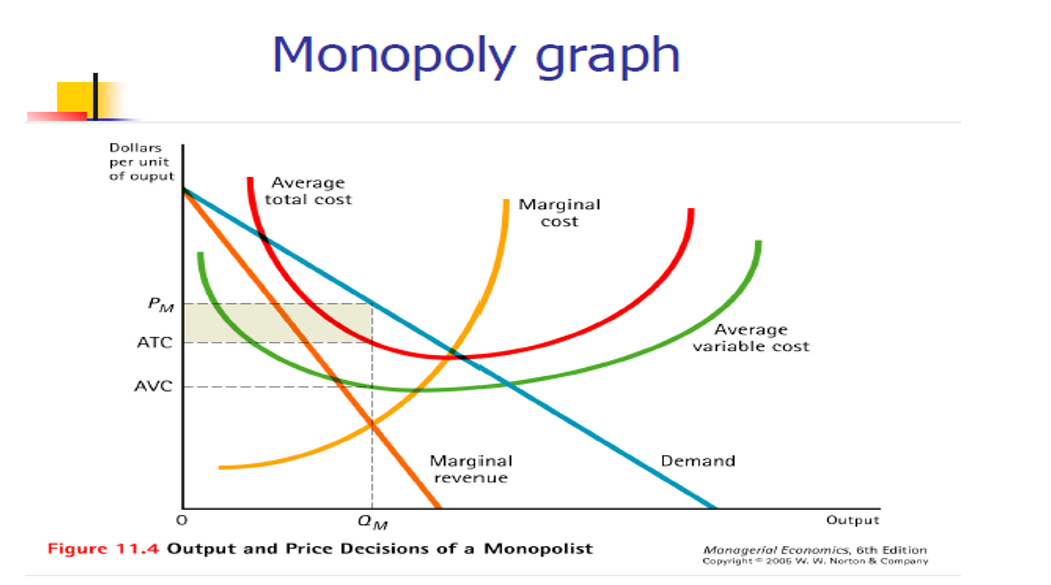
The diagram below shows the nature of BT’s business model under monopolistic profit maximization (Arnold, 2008).

When BT became a public company under the perfect competition market model, it needed to get business licenses that affected its business operations. For example, producing and supplying apparatus became a long process involving high costs and many procedures. Additionally, the company’s telecommunication services started facing competition from other players/suppliers in the market—this affected demand as well as profits. The company needed to modify its products in order to create homogeneity. It also became necessary to acquire perfect pricing information in order to reduce cases of overpricing or underpricing. All these factors led to high operating costs and a change in BT’s operations and profits (Gordon, 1997).
The basic short-run and long-run behaviors of the model in the business in a “market economy”
Perfect competition is a model that is based on the following assumptions:
- There are several small firms that are producing many products, which means there is no control over the market price (Gordon, 1997).
- There are many homogeneous products with many substitutes.
- There are many buyers for produced goods which mean there is no monopsony power.
- Businesses can enter the market easily, and existing businesses can easily leave the market. Therefore, there are no sunk costs of entry or exit.
- Buyers and sellers are assumed to have sufficient information regarding market conditions, product pricing, and competitors. This information is freely accessible.
Conclusions for a perfectly competitive firm in the short-run

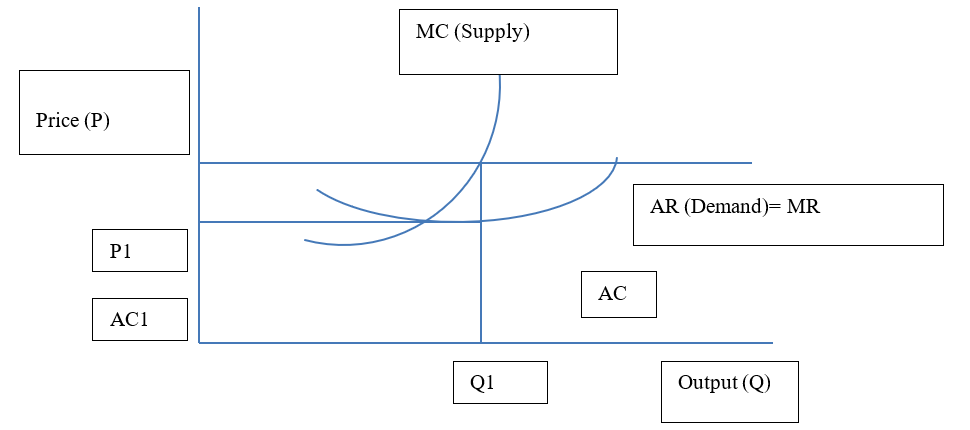
BT Group can achieve profit maximization (equilibrium) in the short-run if it increases output level up to a point where the marginal benefit of an extra unit of output is equivalent to marginal cost. Therefore, the market demand curve and the market supply curve form the equilibrium. P is the market price, while Q1 is the quantity produced. The average revenue (AR=MR) curve is the demand curve for the individual firms in the telecommunications industry.
AR curve is equal to the MR curve because the market price is the same for every unit produced. Therefore, the profit maximization point is Q1; where MC=MR
Conclusions for perfectly competitive firm in the long-run
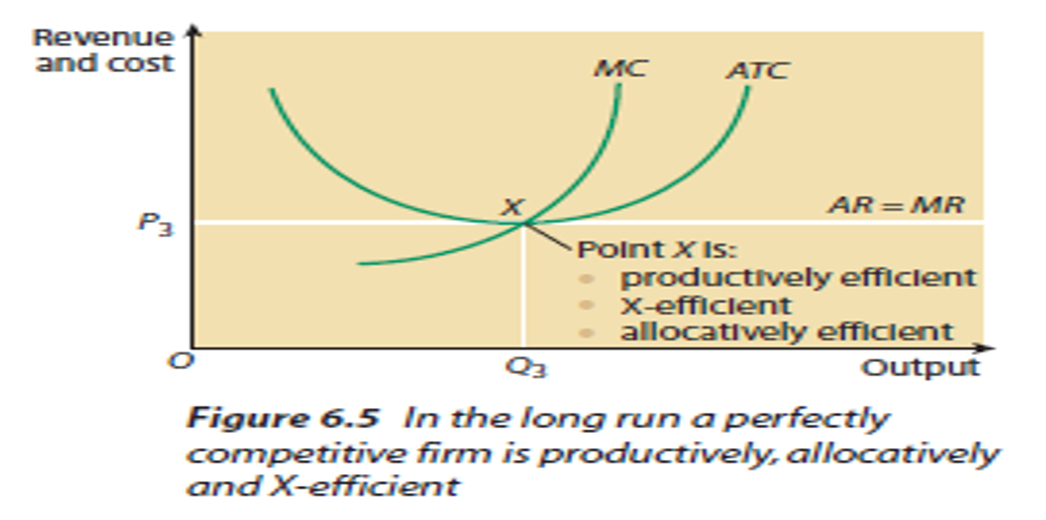
The firm attains productive and allocative efficiency in the long-run. This takes place when the company does not have economies of scale. The firm attains productive efficiency when it produces at the optimum level and at the lowest point of the Average Total Cost (ATC) curve. Additionally, the firm attains allocative efficiency because P=MC. This means that every firm in this market is producing at the point where P=MC (Price=Marginal Cost). BT must be X-efficient in the long run in order to achieve perfect competition. This is because if the firm offers services at a rate that is more than ATC curve, it would not achieve long term financial objectives. Therefore, for BT to survive (generate normal profits) in the market it needs to remove organizational slack (X-inefficiency).
The diagram below portrays the long-run equilibrium of firm (BT) under perfect competition (Gordon, 1997).

Factors that affect the degree of competitiveness in the business
Inputs: they include labour, materials and capital costs. These are used in operating the telecommunication industry. Labour costs include direct and indirect staff costs such as pension, salaries and medical benefits. Material costs include the office supplies and payments for telephone operation charges (Kiss & Lefebvre, 1987).
Outputs: these refer to services being provided by BT. For example, subscriptions and minutes used during the company’s daily operations. They can also be measured by the revenues obtained from all the telecommunication services. This factor determines the level of income that BT has versus its competitors.
Examples of productivity measures used in the telecommunications industry are:

Total Factor Productivity (TFP) calculation method: this method relates change in TFP to change in the ratio of change in output to change in input. ‘In’ is the natural logarithm. Input and output data is in form of weighted average (Gordon, 1997).
Therefore, change in TFP= change in input variables (Q) – Change in output variables (F)
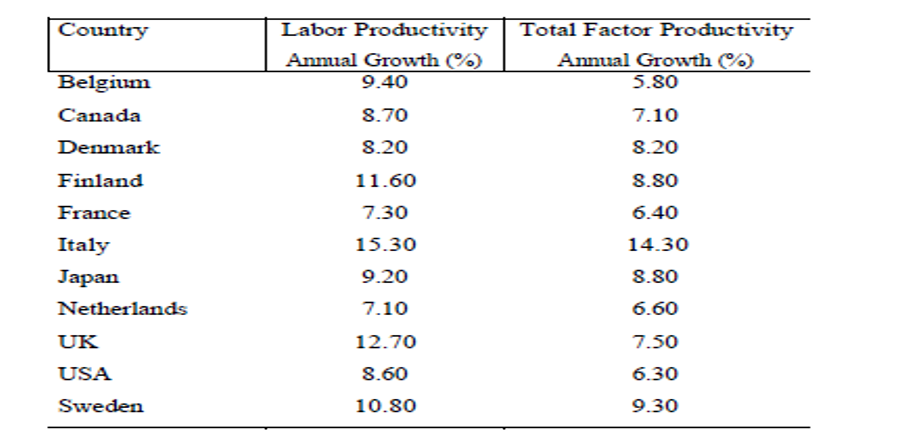
Measuring labour productivity: this can be measured by dividing volume by the number of telecommunication staff. The table below shows the mean labour productivity for telecommunication industries in various countries. For example, UK recorded labour productivity of 12.79% between 1980 and 1998 (Gordon, 1997).

Capital contribution is also a method of measuring productivity: this measures the degree to which investments are utilized (capital consumption). It is measured by capital depreciation and amortization costs divided by the total fixed assets (Gordon, 1997).
Research on two of the business’s closest competitors to determine the pricing strategy for each business indicating how knowledge of this information may influence pricing decisions in your business
Vodafone Group Public Limited Company and Telecom Italia S.P.A are among the closest competitors of BT Group. Currently, Vodafone is offering free browsing on its portal. This is also called ‘walled garden’. Therefore one has to be a Vodafone user in order to subscribe. Some of the services being offered are ringtones, news, sports among others. Knowledge of this information can make BT Group to reduce the prices it offers on its calls. BT can also introduce toll free tariffs during the night (Arnold, 2008).
On the other hand, Telecom Italia S.P.A, Paraguay developed a cost rationalization and efficiency plan aimed at increasing efficiency from 42% in 2009 to 58% in 2012. Additionally, the company’s Paraguay division has strengthened its 3G mobile network and internet services. This is aimed at reducing the browsing costs. This information can help BT to strengthen its internet and network services so that it can remain competitive.
Recommend pricing policy for the business you chose. Assess how your pricing policy maximizes profits for the business (Arnold, 2008).
Before setting up pricing policies, BT Group should develop pricing objectives. This means that the company should aim at maximizing the current profit by reducing its costs. Additionally, the company should maximize its revenues. This can be done by seeking more revenue sources. The company should also adopt quantity maximization in order to increase the level of products or services being offered for sale. The company should use quality as a tool for profit leadership. The final pricing objective would be to request for status quo. This would reduce price wars between BT Group and its competitors (Arnold, 2008).
One of the pricing policies that the company should adopt is ‘skim pricing’. This is done by establishing a high price towards the customers that are less sensitive to prices. The objective would be to achieve profit maximization. This policy is most appropriate when demand is expected to be almost static and when the company has insufficient funds for capital expenditure. The other pricing policy that the company can use is penetration pricing. This is aimed at maximizing quantity sod by reducing the selling price. This policy is best applicable when demand is expected to change frequently and when there are threats from other competitors (Arnold, 2008).
References
Arnold, R. (2008). Economics: Available Titles Aplia Series (9th ed.). London, UK.: Cengage Learning.
Gordon, R. J. (1997). Is there a tradeoff between unemployment and productivity growth In Unemployment policy?: Government options for the labour market. Cambridge: Cambridge University Press.
Kiss F. and Lefebvre, B. (1987). Econometric model of telecommunication firms: A survey. Revue economique, 38 (1), 307-373.