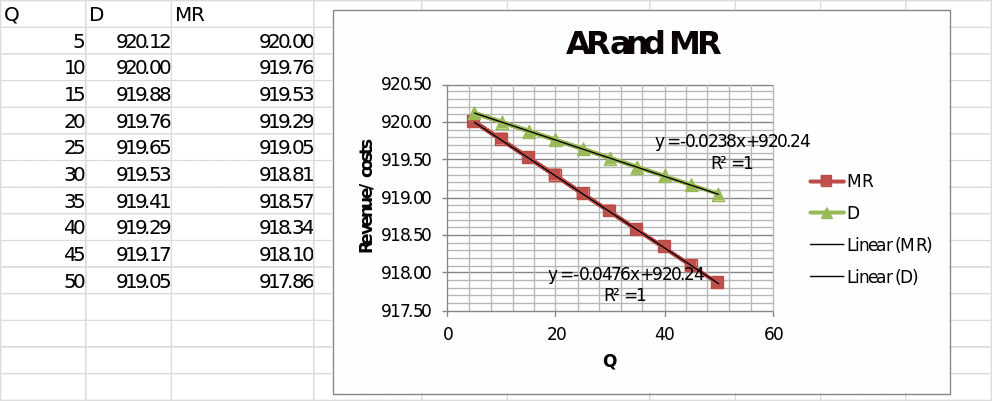
The low-calorie frozen food company is operating in a monopolistic market structure. According to the regression equation, quantity demanded would decline by 1.19% following a 1% increase in price. This elastic nature of demand curve gives to a downward sloping demand curve as illustrated in figure 1.

Cross-price elasticity of demand of 0.68, which was evaluated in assignment 1, indicates that the frozen food company supplies a product that has a substitute in the market. This is a confirmation of competition in the market. Besides, demand for the good varies with income level as well as advertisement expenditure.
According to Hirschey (2008), monopolistic market structure has many sellers, sell differentiated products, and do not have entry or exit barriers. These characteristics are reflected by elasticities described in the preceding paragraph. Frozen foods, supplied in the market by different companies, vary in one respect or the other such that they are not perfect substitutes. Restaurants sell similar products but due to differentiation, the customer perceives the product as distinct from each other. Such distinct difference is derived from location, atmosphere, product quality, nutritional value, and packaging. In such a situation, the customer is indifferent as to the product to buy. As an example, Nestle Company and Hillshire supply differentiated products.
Competitors in low-calorie food industry
Nestle is one of the leading competitors in frozen food industry. The company is focused on becoming a leader in nutrition health and wellness. It has competitive advantage in product and brand portfolio, research and development capability, presence in various regions, values, culture, and people (Nestle, 2014). In the first half of 2014, the company registered 4.7% growth in a volatile market, driven by real internal growth as well as discount pricing technique applied in a volatile market. Trading profits amounted to CHF 6.4 billion, representing a margin of 15%. Improved efficiency was evidenced by reduced marketing and administrative costs.
The second competitor in low-calorie food industry is Hillshire Brands Company. It is among the leaders in branded foods generating annual sales of about $4 billion. Sara Lee frozen bakery is just one of the many brands handled by the company. According to Hillshire Brands Company (2014), rigorous cost management strategies in addition to brand building and innovation contributed to sales growth in the company. In line with its core principal of keeping the customer informed, the company conducts intense advertisement. Nevertheless, customers have shown concern that low-calorie foods are unhealthy and expensive (Boyle, 2014).
In response to these concerns, the company has opted for discounts, new range of products, and using research to support nutritional value of frozen foods. Companies in frozen food industry often use non-price strategies to increase their sales. Nestle and Hillshire understand the need to different its products in the market. Some of the essential factors that companies in this industry are concerned with include quality, safety, and nutritional content of different brands.
The plan
The first factor to be considered when discussing the effectiveness of the market structure for company’s operations is price determination. According to McEachern (2012), monopolistic structure combines the features of a monopoly and a perfect competition. Considering the short-run situation, output is determined by the intersection of demand curve and marginal revenue, i.e. MR=MC. This is characteristic of a monopoly. The resulting revenue can be increased by improving processes, use of innovative packaging, introducing new products, and conducting intense advertisement evidenced by the case of Hillshire Company.
Secondly, a firm in a monopolistic competition structure is considered a price maker. This is supported by the downward sloping demand curve besides availability of differentiated products. It implies that some brand loyal customers will remain even after experiencing a hike in price. Bearing this in mind, the low-calorie firm can increase the price but should note that high prices drive away customers.
Thirdly, it was observed that demand is relatively responsive to changes in advertising expenditure. Investment in advertisement has the impact of attracting more customers consequently increasing market share. Presently, firms in food industry make use of internet to reach more customers. This is supported by the fact that internet technology has become a way of life for customers. People can now order for food and receive deliveries within some few minutes.
Factors causing changes in market structure
The first factor that might have caused the change from the initial market structure is the nature of demand curve. In the case of a competitive firm, the demand curve is horizontal. Conversely, a firm in monopolistic market has a downward sloping demand and marginal revenue curve. The impact of this difference is apparent in price determination. For a firm in a competitive market, price is derived from the market. This means that a firm cannot set its own price. An attempt to set a price above the market leads to zero sales. It means that the firm loses customers. In the case of a monopolistic market, firms relatively influence price hence are seen as price makers.
The second factor that might have caused the change from the initial market structure is availability of close substitutes in the market as indicated by cross-price elasticity of demand. A competitive firm has perfect substitutes in the market. The calculated cross-price elasticity of demand, however, shows that the substitute is relatively elastic hence is not a perfect substitute. The impact on company operations is that price can be increased without necessarily affecting demand.
The major short-run and long-run cost functions
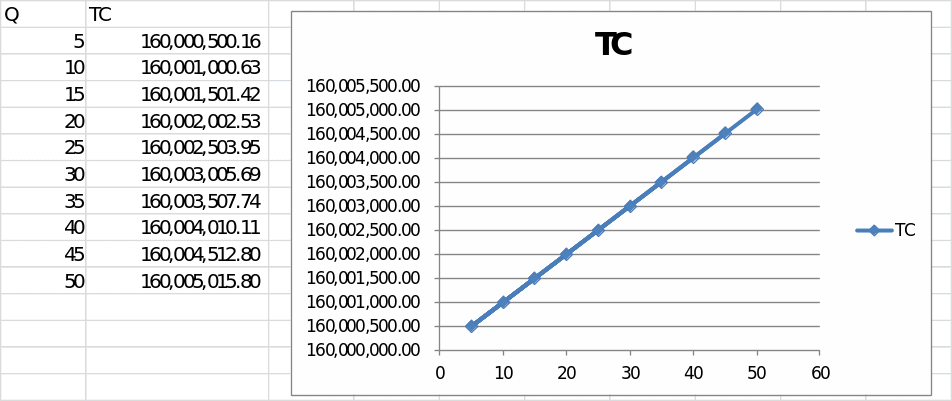
Total cost function given by
and the corresponding figure 2 shows that total cost increases as more output is produced.

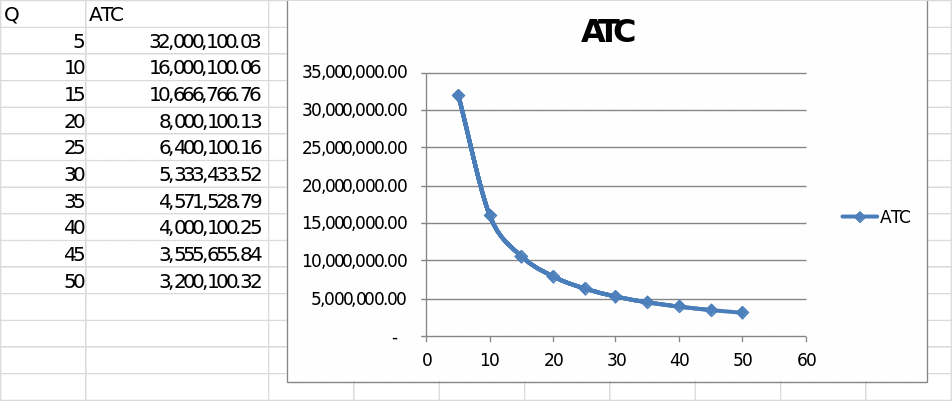
From the total cost function, average cost is obtained as follows:
This average cost function is important to an individual in determining when to continue or stop production. Concisely, production should stop when price is less than average variable cost. Figure 3 illustrates the average cost curve.

The marginal cost function represented by
is applied in determining the profit maximization or loss minimization level of output in both short-run and long-run. Using the output level, price level is obtained from the demand curve in the short-run. The long-run situation is that equilibrium price and quantity is obtained at the point of intersection between marginal revenue and demand curve. This is in combination with the point where the slope of average cost curve is equal to the slope of demand curve.
Discontinuing operations
Operations should stop when price is less than variable costs in the short-run and when price is less than average variable cost in the long-run. An attempt to continue operations when the two conditions have been satisfied makes the company to incur losses. To remedy the situation, the company has to improve processes, use innovative packaging, introduce new products, and conduct intense advertisement.
Profit maximizing output
The pricing policy that will yield maximum profits to the firm is determined by the equilibrium between MR and MC.
Price is obtained from the demand curve
It is evident from the table above that equilibrium output is high in assignment 1 compared with assignment 2. However, the price is low in assignment 1 compared with assignment 2. In summary, a monopolistic firm has high-price and low-output equilibrium points. This observation confirms that a firm in monopolistic market has the ability to set a higher price.
Financial performance
Financial performance is determined by evaluating the profit or loss as shown below.
Note that equilibrium price and quantity is:
In the short-run, MR=MC;
In the long-run MR=MC and P=ATC
At equilibrium;
In the short-run, the low-calorie frozen food firm is making losses amounting to 154,415,945.8. This is likely to drive away firms. In the long-run the firm will earn a profit of 229.22, which is more or less a breakeven point.
Recommendation for profitability
- Introduce new products.
- Improve processes.
- Concentrate on nutritional value of frozen foods.
Plan to achieve the recommendations
- Conduct research on consumer needs.
- Reduce costs by installing new machines that will improve processes.
- Enhance quality of low-calorie frozen foods.
- Introduce innovative packaging that attracts customers.
References
Boyle, M. (2014). Nestle Lean Cuisine Sales Drop as Shoppers Shun Freezer. Bloomberg. Web.
Hillshire Brands Company: Hillshire Brands Annual Report 2013. (2014). Web.
Hirschey, M. (2008). Fundamentals of Managerial Economics. Mason, OH: Cengage Learning. Web.
McEachern, W. (2012). Economics: A Contemporary Introduction. Mason, OH: Cengage Learning. Web.
Nestle: Strategy – Nestlé Roadmap to Good Food, Good Life. (2014). Web.