Introduction
The company is positioned as the world manufacturer of sports shoes. Originally, particular products (sport shoes as for the Converse Company) are regarded as the main factor of product positioning. The positioning of the action on the world market is the aim to become the manufacturing leader with the observation of all the rules of professional manufacturing (using ecologically clean, durable and reliable materials).
The company currently produces footwear at 2 plants—a 2 million-pair plant in North America and a newer 4 million-pair plant in Asia. Both plants can be operated over overtime to boost annual capacity by 20%, thus giving the company a current annual capacity of 7,200,000 pairs. Sales volume in Year 10 equaled 5.2 million pairs, so there’s no immediate urgency to add more capacity. At management’s direction, the company’s design staff can come up with more footwear models, new features, and stylish new designs to keep the product line fresh and in keeping with the latest fashion. The company markets its brand of athletic footwear to footwear retailers worldwide and individuals buying online at the company’s Web site.
The key factor of the positioning is the achievement of the world scales of manufacturing and the steady improvement of the qualification within engineers, manufacturers, and managerial teams.
Entering the industry is the most difficult part of business development. The entering process is seen as a complex strategy, which would entail several directions, including market research, advertising strategy, industrial intelligence and research of the competitor’s managerial and industrial performance. It should be mentioned that the strategy will depend on several factors, such as the price strategy, HR policy and principles applied by the competitors. The fact is that,
entering the market depends on the team, consequently, it is necessary to gather professional and faithful team, which will be sufficiently motivated to reach the success with the growing company.
The strengths of the company are the steady development (The graphs and tables revealed that the development process was rather successful with inseparable successes and failures, which were overcome).
Global Environment for Sport Shoes
PESTLE analysis
Political
Political situation for sports shoes manufacturing is rather favorable. The governments of South Africa and Asian Countries do not restrict this activity by political decisions or economic pressure. The social policy which is held by the governments of these countries promote successful development of this business, moreover, this is regarded by the government as the governments of these States as the solution of several problems, including unemployment, poverty and lack of investments. As for the economic policy, held by the governments, the manufacturing is regarded as the contribution to the national welfare, as the taxes and salaries are paid.
Economic
Taking into account the economic environment of this sphere of business, it is necessary to mention that it is rather variable and it depends on the general economic situation in the world region. Sports shoes are of high demand, as it is the universal footwear, which is used in the everyday life. Even in the circumstances of the world crisis people go on buying sneakers and other footwear for casual use. As for the high tech shoes, which are full of electronic components, these goods are not rather popular, and may be attributed to the category of luxuries.
Sociological
Sociological environment is also favorable. It is claimed that the social situation in the countries of manufacturing concentration is the most favorable for this type of manufacturing. The citizens of Asian countries agree to work overtime for additional reward. Moreover, it is almost the only opportunity for the population to earn their leaving and get the sufficient salary. Taking into account the necessity to develop the sphere and increase the industrial powers, social situation in Asian States is the most suitable for it.
Technological
Technological part of this sphere is one of the most successful. The fact is that, the allover computerization of the manufacturing essentially simplifies this process. Technological background of shoe manufacturing promotes the further development more than any other sphere. This helps to decrease the amount of technical workers, and pay more attention to the qualification improvement of technical workers. However, this is the double end stick, as the high tech manufacturing requires high qualification level and better unification of the manufacturing team.
Legal
This sphere is the least favorable, as companies who choose to locate the industrial powers in the third world countries face the difficulties with the labor law and legal issues linked with the working schedule, minimal salary and the working conditions in general. Most companies prefer paying less, and setting up the prolonged working day (and sometimes even night shifts) for the workers, who mainly consist of the local population. In spite of the fact that workers are mainly satisfied, as this is the rare opportunity for them to earn their living, the world organizations are dissatisfied with the actual situation. The bight example is the scandal, linked with Nike manufacturer: the workers were obliged to work 14 hour day shift, and the newspapers all over the world accused Nike in slavery, however the workers did not complain.
Environmental
Environmental situation in the world leaves to wish better, however, the technical side of the manufacturing helps to improve ecological conditions. The high tech materials and technologies which are used are aimed to decrease the contamination of the environment. Moreover, taking into account the requirements of Kyoto protocol, the industrial wastes are essentially decreased all over the world, except several countries, thus, the situation is steadily stabilizing and improving. (Lee, 2005)
Five Forces Analysis
The threat of substitute products

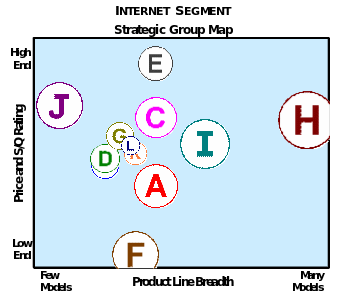
The scheme reveals the real situation on the sports footwear market. Company “C” is not the leader, however, the tendency is leading to the success.
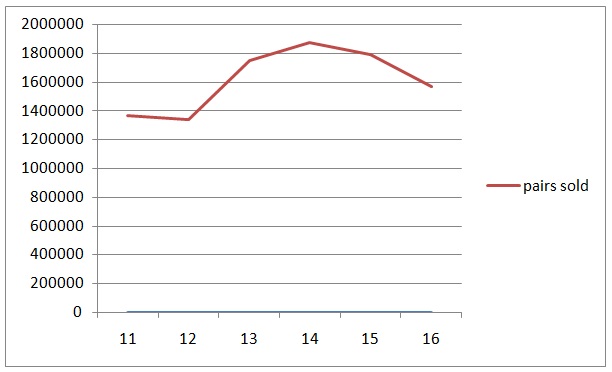
As for the issues of buyers propensity to the substitute goods, it is necessary to mention that this factor is essential, however, not the key one. According to the reports, the market share of the company C is approximately 9%. Taking into account the amount of the substitute companies, this number is huge enough. Though, the threat is moderate, and the slight increase of the prices during the period Y13-Y14 did not affect the situation seriously. However, it decrease since Y10, as the amount of powerful competitors increased, and managed to take 3% of the market share.
Relative Price Performance of Substitutes
The prices set up by the competitors are not too different, though, the price is not the key factor which helps to conquer the market. Originally, the prices are approximately equal, and the variations are minimal.
Buyer switching costs are unknown. These costs are not included in the report, and the tendency is impossible to chase basing on the market share and price changes.
The threat of the entry of new competitors
The barriers and obstacles were discussed earlier. The only fact that should be emphasized is the sufficient filling of the market, which creates the main obstacle.
The product differences are represented in the brand names and the technologies of manufacturing, as various manufacturers prefer some particular technology. (Buckley, Casson, 2006)
The capital requirements may be another barrier, however, the analysis of the business starting activity revealed that the requirements are up to half million dollars (entailing market research, advertising and slight industrial powers).
Access to distribution is almost unrestricted; however, the market is slightly overfilled with the similar production
The government policies were discussed in the PESTLE analysis chapter, and it is claimed that the political situation is rather favorable for the manufacturing.
The intensity of competitive rivalry
The market is represented by 12 companies, however, in spite of numerable companies, the growth rates are low, as the market is overfilled, and there is no space for growth.
The bargaining power of customers
The bargaining power is sufficient for all 12 companies were able to exist. The market share rates, the prices and the tendencies for the sales increase emphasize that the customers are able to buy the manufactured footwear.

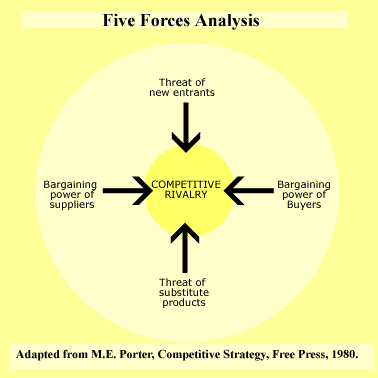
The general situation, featured by the Competitive Rivalry is most likely to be high where entry is likely; there is the threat of substitute products, and suppliers and buyers in the market attempt to control. This is why it is always seen in the center of the diagram.

Strategic plan for entering the industry
The strategy of entering the market was based on Michael Porter’s principles of entering the market. The company was also penned down the future environmental challenges and an appraisal of the firm after 10 years. In the words of Gamble “ there are countless variations in the competitive strategies companies employ, mainly because each company’s strategic approach entails custom-design actions to fit its own circumstances and industry environment.”
The above diagram is adapted from Michael E. Portal, Competitive Advantage (New York: Free press, 1985).
The following will explain briefly on each of the generic strategies:
- Cost Leadership: striking to a broad range of consumers by being the overall low cost provider of a product or service.
- Differentiation: in quest of differentiating the company’s product/service offering from rivals’ in ways that will appeal to a wide variety of buyers.
- Cost Focus: focused on a narrow buyer segment and outcompeting rivals by serving niche members at a lower cost than rivals.
- Differentiation Focus: focused on a narrow buyer segment and outcompeting rivals by serving niche members customized attributes that meet their tastes and requirements better than rivals’ products.
Company Development
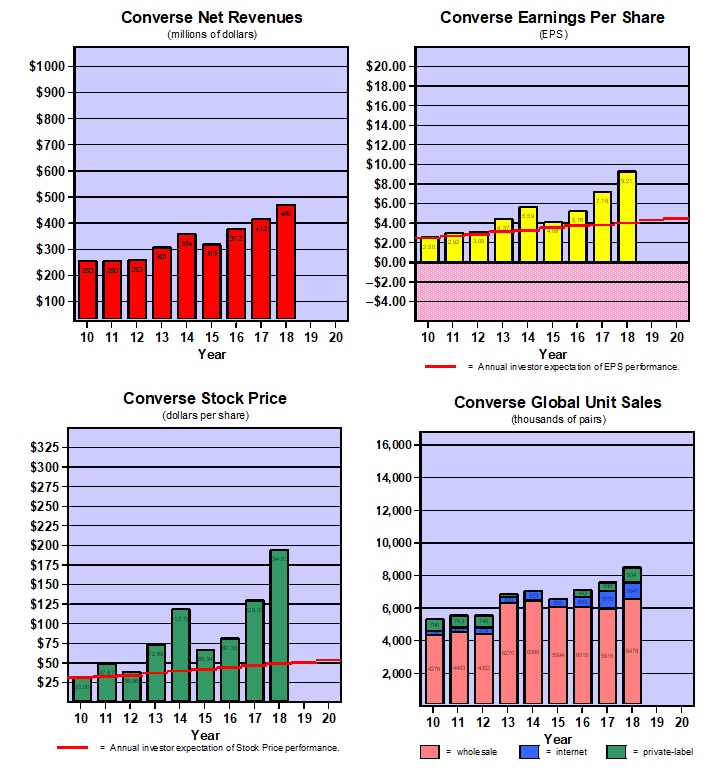
From the very beginning, the company started its steady and successful development. It is necessary to mention that the successes were rather observable, and, according to the data in the graphs, the revenues and stock prices increased. This happened due to the observation of the Strategy models of Porter. It is claimed, that Porter’s five forces entail three forces from ‘horizontal’ competition: threat of substitute manufactured goods, the threat of established competitors, and the threat of new market players (market entrants); and two forces from ‘vertical’ competition: the bargaining force of suppliers and bargaining power of consumers (Dess, Lumpkin, Eisner 2006). It is also claimed (Thompson, Stappenbeck, 2008) that according to Michael E. Porter, the five forces model should be applied at the manufacturing level; it is not intended to be used at the industry group or industry sector level. An industry is classified at a lower, basic level: a market in which comparable or closely related products are sold to cosumers.
The situation was essentially simplified by the fact, that Converse company was a threat itself for the others, as it was the new market entrant. Due to thoroughly elaborated tactics and competitive strategy, which entailed lowered costs and high quality “green” materials, the Converse Company manages to conquer essential part of the market (12%).
The essential volumes of investment ($183,250,000) helped the company to make the first step in entering the market. This amount was spent on the entering strategy implementation, which entailed not only purchase of the equipment and employment of the working force, but also advertising strategy implementation, elaboration of the management rules and principles, training the management team and providing the necessary amendments to the strategy basing in the results of Y10. In general, Y 11 was featured by the steady growth of Earnings per Share, Stock Price and Global Unit Sales. It is necessary to emphasize that the key choices, that were made entailed the increase of the industrial powers in Asian countries, and constant decrease of the employers in North America in order to decrease the expenses for salary, working insurance and improvement of working conditions, as the North American workers are rather demanding. Even in spite of the fact that North American powers are much more productive, the overall expenses and revenues appeared to be higher, if the main manufacturing volumes and powers are located in Asia.
As for Y12 results and outcomes, it should be emphasized that the plant capacities stayed on the same level, however, taking into account the decrease of the amount of the workers (from 496 till 391 and 1,401 till 1,396), the productivity per worker increased (from 4,046 till 5,135 and 2,519 till 2,527). The overall investment decreased ($177,150,000), nevertheless, the overall indexes (except the stock price) increased. The decrease of the stock price may be explained by the decrease in the investment, and entering of the new market players. Thus, the overall share was re-distributed, and the stock price decreased.
Y13 is featured with the decrease of the manufacturing volumes. The amount of the workers employees in North American region decreased, so, the manufacturing volumes lowered (5,900,000 pairs in comparison with 6,000,000 during the previous two years). All the indexes rose, which reveals steady and successful development of the Company and the improvement of the manufacturing and management strategies. It should be emphasized, that the expenses for equipment and construction upgrades made up $14, 750, 000. In comparison with the previous years, and the flowing year, this is the highest sum, spent on upgrades. This caused the growth of the indexes for Y14, and slightly impacted the growth during Y 13.
Y14. The price per pair slightly increased, as the industrial volumes stayed on the same level in comparison with the previous year, and the overall investment decreased again (172, 445, 000 this year). The return on average equity was 22.4%, which is almost 2% higher than the previous year returns (20.6%). The allover indexes are rather high, as the expenses are comparatively low, thus, the profits increased, and the forecast appeared to be rather favorable (which impacted the growth of the stock prices)
Y15.This year became the record for the upgrade investment rates. $39,000,000 was spent for the new construction technology, which was aimed to improve the quality of the manufacturing. The expenses for marketing strategy implementation increased, however the increase of the expenses aimed to improve the overall performance essentially impacted all the indexes (Net Revenues, Earnings per Share, Stock Price and the global Unit Sales lowered). Still, the manufacturing rates increased (up to 6,800,000 pairs).
Y16. The further growth of the available capacity (7,800,000 pairs), caused the increase in the sales volumes. This increase allowed lowering the price per pair in some regions; however prices in other regions stayed the same or slightly increased. It is claimed that the growth of available capacity is linked with the construction of the additional industrial powers in Latin America. The investment for this construction budgeted $43,900,000, thus, the growth of the indexes was slight.
Competition
This process was featured with the constant battle for the market share, for the customers and profits. In comparison with the other companies, C Company showed steady stable and successful development. Y10 is not included in this analysis, as it was the year of entering the market for the majority of the companies. Y11 is featured with the constant growth and the allocation of the market share within the companies. Y12 was one of the most disastrous for C Company; however the competitors such as Honor and IMAXX revealed rapid leap in the indexes.
Y13. C Company places the third position. Originally, it is one of the most successful years for the company. There is an essential gap in scoring in comparison with the companies from the 4th position and down, and the three leaders (IMAXX, Honor and C Company)reveal the best results in investor expectation scores, Best-in-Industry scoring and the Overall scoring.
Y14. The positions of the leaders stayed the same: however, the gap is decreased, and, there are more pretenders for the leadership.
Y15.Converese was moved to the 4th position. In spite of the low indexes, the changes on the scoreboard are not so significant. IMAXX and Honor has changed, and honor is the leader now
Y16. IMAXX returned its 1st position, and the Converse Company is pressed back to the 6th position.
Conclusion
The strategic actions by the Converse Company did not lead the company to the first place of the scoreboard (market), however, the position, which was placed by the company, is one of the most stable. Originally, the scoring stayed on the same level, which is rather significant achievement in the circumstances of the growing market and empowerment of the competitors, thus, there are no reasons to stop struggling the market. Still the indexes achieved the rates that were looked forward, as along with the increase of the incomes, investments and upgrades, the company managed to create the financial reserve for the future growth of the manufacturing powers.
The declared strategic positioning is rather just and precise, thus, there is no necessity to be inconsistent with it. Anyway this simulation helped me to practice the gained knowledge on the matters of the strategy of development and competition in the circumstances of the growing and developing market.
References
Buckley, P. J., & Casson, M. C. (2006). Models of the Multinational Enterprise. Journal of International Business Studies, 29(1), 21.
Dess, Lumpkin and Eisner (2006). “Strategic Management: International Edition” McGraw Hill Publishing.
Lee, S. (2005). Independent Record Companies and Conflicting Models of Industrial Practice. Journal of Media Economics, 8(4), 47-61.
Thompson, A & Stappenbeck, G (2008). “The Business strategy Game On line” McGraw Hill Publishing.
Waring, G. (1998). The Essence of Corporate Strategy. Australian Journal of Management, 23(2), 237.
Appendices
