Gantt Chart
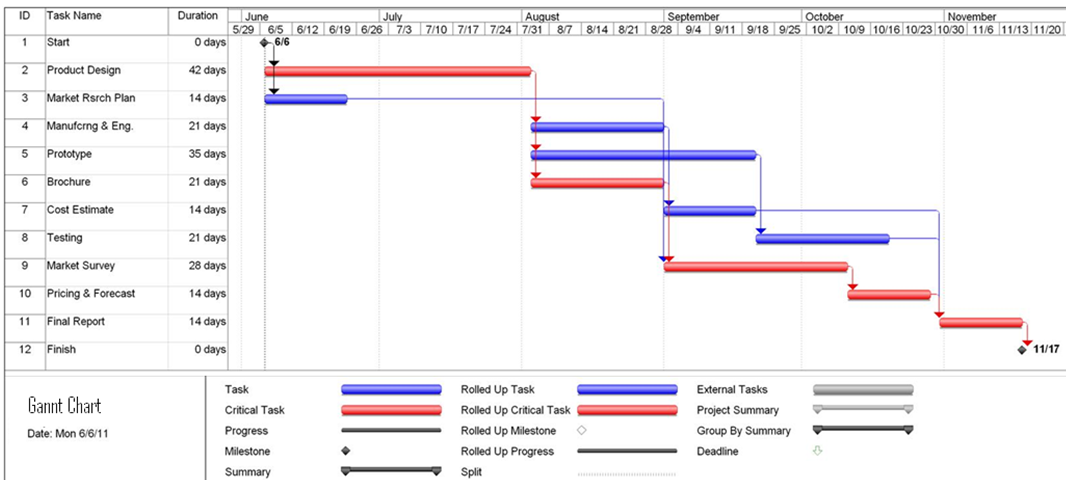
“A Gantt chart is a graphical representation of the duration of tasks against the progression of time,” (The Global Voice of Quality, 2004). It is usually an important tool that is used in scheduling of projects and planning activities (Tague’s, 2004). The Gantt chart below has been produced by using Microsoft Office Project and shows the activities for building a cordless vacuum cleaner.
The red bars show the critical tasks while the blue bars indicate the normal tasks. The time scale has two tiers; the middle tier gives time duration in months while the bottom tier gives time duration in weeks. The task names and their durations are given in the second and third columns.

Duration of Project in Weeks
By using the critical path from the Gantt chart above, the project duration is found to be 17 weeks. Therefore, this is the earliest time by which the project can be completed. More ways of presenting and identifying the project duration are as described in the following paragraphs.
Activities-On-Node Network
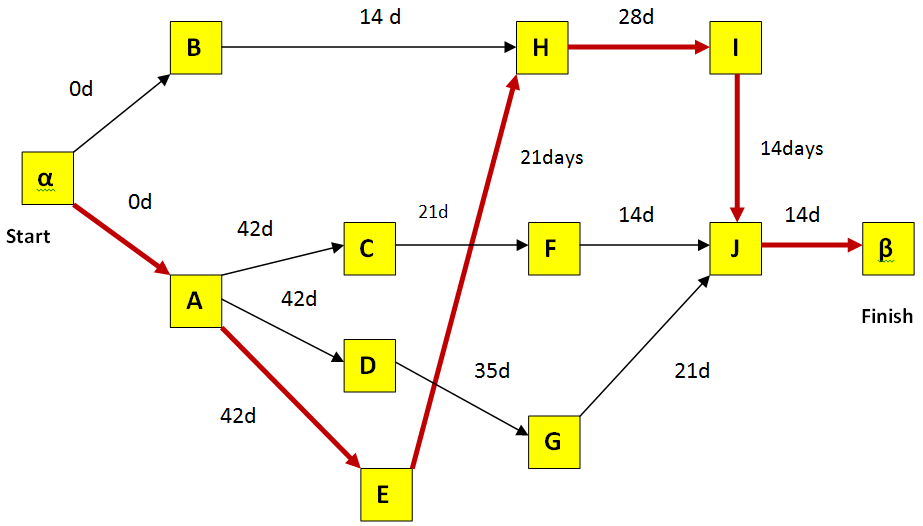
In an activity-on-node (AON) network, nodes are used as a representation of the activities while arrows are used to show precedence relationships (Vasileios, 2008). The diagram below shows an activity-on-node network generated from the activities required for building a cordless vacuum cleaner. The activities are given in days while two milestones (start and finish) have been used in the drawing.
In the network diagram, the dark red arrows represent the critical path while the black arrows represent other normal activities. The full analysis of this network diagram is given in the following pages.

Network Analysis
In this section, the analysis of the activity-on-node network from figure 2 above is conducted in detail. This involves identifying the relationships of the as seen in the diagram to analyzing the implications that arise from the relationships as described in the following paragraphs.
As shown on the diagram, the activities (tasks) are represented by the nodes (vertices) of the graph. Therefore, the diagram is a representation of an activity-on-node network diagram as mentioned earlier. As such, the length of an activity is the duration of the corresponding task.
Therefore, start and finish of a task is a representation of two stages of the project (Hyperthot, 2007). Two stages (start and finish) have been introduced in the network diagram to indicate the commencement and completion of the project. Within this stages are a series of intermediate stages which are defined by the activities.
In the network diagram, the commencing milestone with an alpha sign defines the start of the project, but does not use resources (Vasileios, 2008). The start is followed by two independent activities A and B. Task A and B takes 42 days and 14 days respectively to be completed. After the completion of task A and B, there are three more options (C, D, and E) that can be undertaken.
Task H cannot commence because it is preceded by both task B and E which have to be done to completion before starting H. Therefore, only task C, D, and E can commence at this point. Task C and E have a completion period of 21 days each, while task D has a completion period of 35 days. After completion of task (C, D, and E), there are three more options (F, G, and H) that can be undertaken.
Since task B and E succeeded task H and are now both completed, task H can also commence. Task F, G, and H will require a completion time of 14 days, 21 days, and 28 days respectively. Completion of these tasks opens way for task I. Since task J is preceded, by tasks F, G, and I, then the task will not commence until the completion of task I is confirmed.
Therefore, task I (14days) will commence after the completion of task H and open way for the commencement of task J. Since all the predecessors (F, G, and I) of task J are now complete, task J commences. As the last task, task J runs for 14 days and marks the end of the project. Finally, a completion milestone with a beta sign as shown marks the finish point of the project.
The longest path linking the start and finish point in a network diagram through a series of intermediate activities is the critical path. As such, the critical path is referred to as the earliest time by which a project can be completed as determined by the network diagram.
In this project, the critical path is made up of 5 activities which add up to 119 days. Therefore, the project duration for this scenario is 119 days or 17 working weeks. However, if any critical activity is delayed, the project finish time is also delayed (Verzuh, 1999). Also, if an activity along the critical path is finished earlier, then the critical path is reduced meaning project finish time is reduced.
In the paragraphs that follow, the descriptions of the critical path activities, project duration, and the floats of non-critical activities are given.
Critical Path Activities
There are five critical path activities as listed below.
- Activity A (42 days) – Product Design.
- Activity E (21 days) – Marketing Brochure.
- Activity H (28 days) – Market survey.
- Activity I (14 days) – Pricing and forecast.
- Activity J (14 days) – Final report.
Critical path activities make up the longest path linking the start and finish points of a project (Vasileios, 2008). Therefore, they play a significant role in determining the outcome duration of a project (Essential Skills for an Excellent Carrier, 2011).
If any such activity is affected, then the project duration is affected either positively or negatively. In this project, altering activity A, E, H, I, and J will cause a variation in the project duration by either delaying or reducing the project finish time.
Project Duration
As shown from the above analysis, 119 days or 17 working weeks is the required time to fully complete the project. As a matter of fact, the minimum duration of the project is determined by the length of the longest path between the start and finish point of the project (Thomsett, 1980).
This is indicated by thick red arrows as shown in the network diagram. There are five critical activities which are; activities A (42 days), E (21 days), H (28 days), I (14 days) and J (14 days). Summing up the lengths of these critical activities gives a total of 119 days or 17 weeks. Therefore, the project duration is 17 weeks.
Floats of the Non-Critical Activities
“A float is the amount of time a task can be delayed without delaying a succeeding task or affecting the duration of the project” (Encyclopedia of Management, 2011). Below are floats within the cordless vacuum cleaner project.
Early-Start Gantt chart & Resource Profile
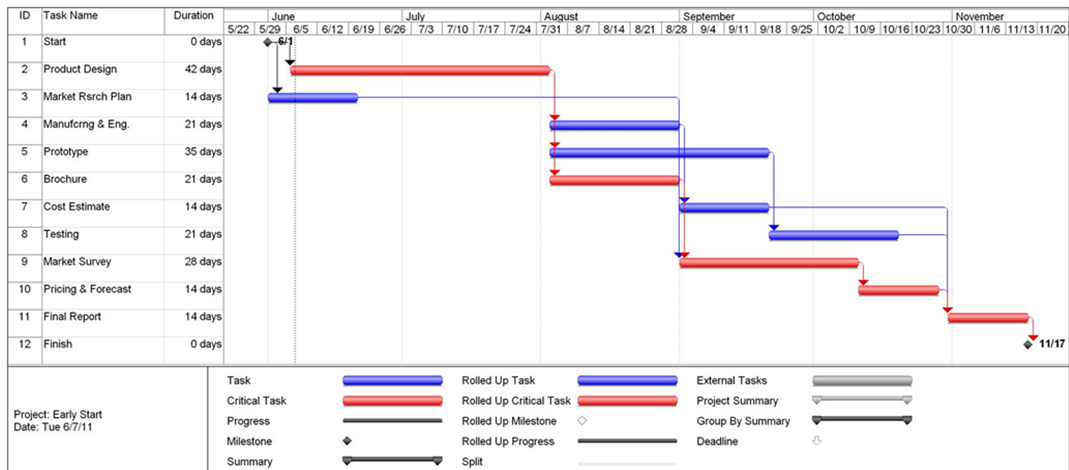
The Gantt chart diagram below represents an early start version of the vacuum cleaner project.

Conclusions
From the analysis, the project duration has been identified as 119 days or 17 weeks. This is reflected by the summation of the five critical path activities. Therefore, building a cordless vacuum cleaner will require a minimum of 17 weeks to be completed. This confirms that the critical path method is efficient and can be effectively used to provide project duration estimates for similar projects.
References
Encyclopedia of Management. (2011) Program Evaluation and Review Technique and Critical Path Method, Enotes.Web.
Essential Skills for an Excellent Carrier. (2011) Critical Path Analysis and PERT Charts. Mindtools. Web.
Hyperthot. (2007) Work Breakdown Structure. WBS. Hyperthot. Web.
Tague’s, D. N. (2004) The Quality Toolbox. ASQ Quality Press.
The Global Voice of Quality, Quality Tools. (2004) Project Planning and Implementing Tools. ASQ. Web.
Thomsett, R. (1980) People and Project Management. Englewood Cliffs, NJ: Yourdon Press.
Vasileios, P. (2008) Project Planning and Control.
Verzuh, E. (1999) The Fast Forward MBA in Project Management: Quick Tips, Speedy Solutions, and Cutting-Edge Ideas. New York: Wiley.