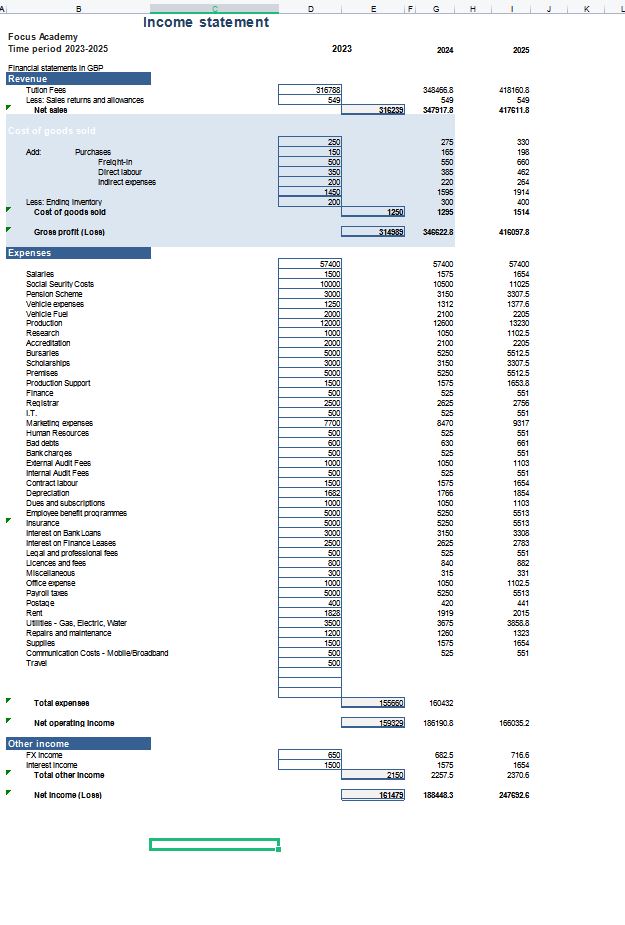
Project Income Statement in GBP

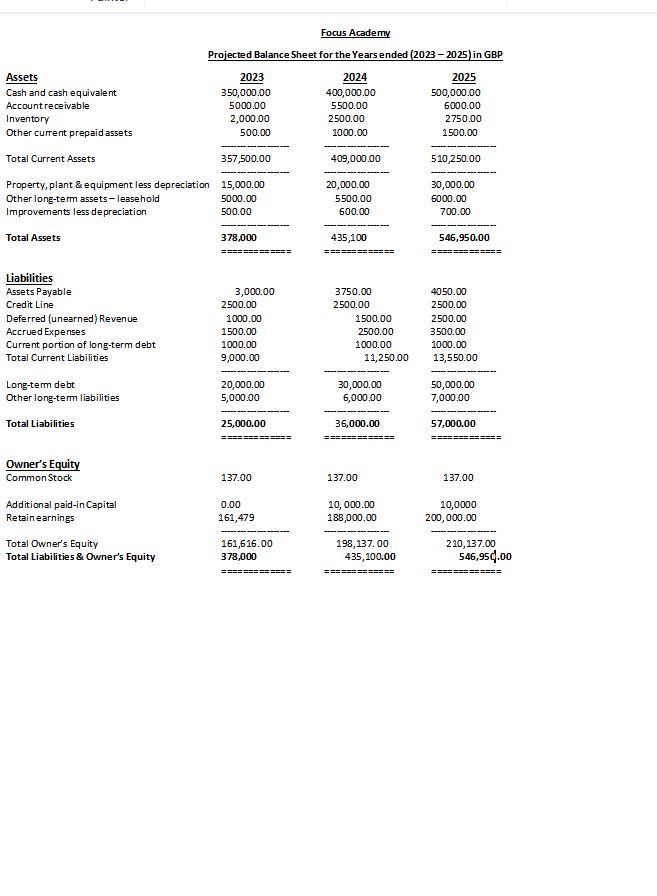
Projected Balance Sheet in GBP

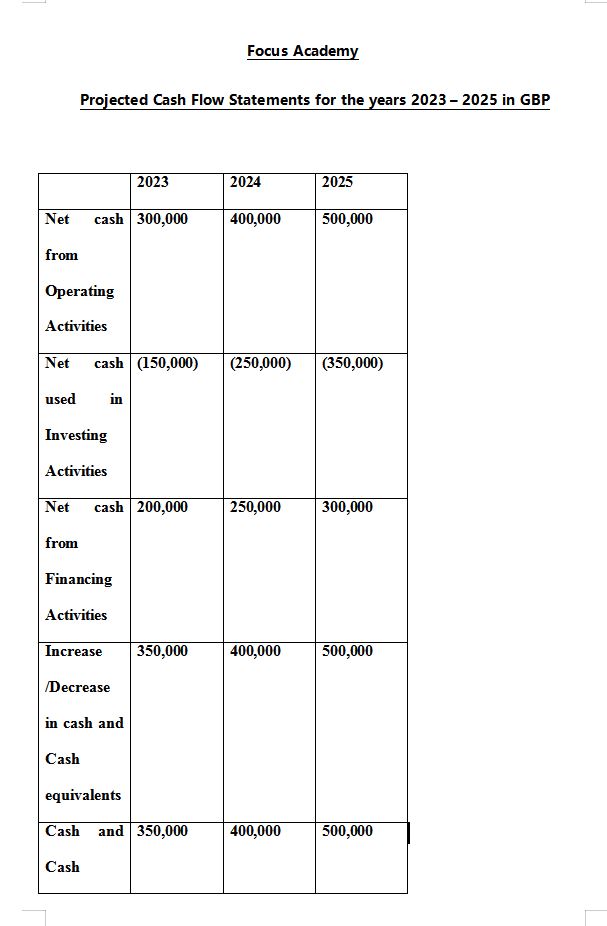
Projected Cash Flow Statement in GBP

Projected Cash Budget for the first 6 months in GBP
The above table shows the summary of both fixed and variable costs to be incurred by the company during its operations. At the end of every month, the total costs are added and then subtracted from the revenue generated. Based on the analysis, the company will experience continuous profit because the revenue value in each month is greater than the expenses, thus allowing the business to have a positive balance.
Payback Period Analysis
Payback period analysis is a significant evaluation necessary for the start-up enterprise. It allows the business owner to determine the amount of time the entity will take to generate the capital invested. In other words, it is the length of time needed for a project to reach its break-even point (Hesser et al., 2017). The payback period formula is given by Payback period = (Initial investment- Opening cumulative cash flow) / (Closing cumulative cashflow-opening cumulative cashflow). For the investors and stakeholders who would have invested their capital and resources into the company to recoup their investments, the payback period should be within five years of operations to qualify the venture as viable and worth undertaking. Based on the given business scenario, the expected payback period is determined by;
Payback period = (Initial investment- Opening cumulative cash flow) / (Closing cumulative cashflow-opening cumulative cashflow)
= (€20,000- € 18,000) / ($€26,000 – €18,000) = 0.25
The payback period for the project is two years and four months, which is relatively, short than the average industry payback period of 5 to 7 years. Therefore, the project which will lead to the establishment of the firm is commercially viable and, therefore, should be pursued (Barrow, Barrow and Brown, 2018). This is because the business will be able to recover the money invested in it within the shortest time possible.
Break-Even Analysis
Break-even analysis is a crucial evaluation for the start-up business because it allows the management to identify the point where the organization has sold enough products and services to recover the money invested in the enterprise. It is a financial calculation that examines the cost of starting a new business versus the selling price of every unit produced to establish where the entity begins making profits (Creese, 2017). Break-Even Analysis formula for year 1= (Fixed cost * sales) / (Sales-Variable Costs)
= (150,000*180,000) / (180,000-125,000)
= €490,909
The company will break even by the year 2025 when sales revenues exceed the break-even mark. This is a reasonable estimate because most company’s break-even between years three to year four, and therefore stakeholders of the company should proceed to invest in the project. From the analysis, it is evident that the firm will need about two years to recover the cost incurred in its operations and establishment.
Financial Statements Interpretation for Year 1
Based on the table above, it is evident that the company will make a profit margin of 45.7 percent. The value indicates that the company will be successful in its sales, thus creating high income for the business. The analysis shows that the firm will experience excellent financial health, enabling it to operate effectively in the industry.
Current ratio
The current ratio is the correlation between the available current assets and short-term liabilities. The table above it has a value of 0.4 times, which implies the corporation cannot easily pay for its debt obligations using the available current assets. The figure may be a worry to most lenders because the ability of the firm to pay its short-term borrowings is low (Nuryani and Sunarsi, 2020). Therefore, it can limit the business from accessing loans from financial institutions. Even though the low current ratio is not appropriate for an enterprise, it indicates that the company management is capable of utilizing the current liabilities to generate more income for the firm. Moreover, it shows that the business has the ability to negotiate its pay period for the depts.
Debt to Equity Ratio
The debt to equity ratio is a financial tool used by investors and company management to establish the amount of capital contributed by indebtedness and the ones provided by the equity. It is crucial in evaluating the financial health of an organization because a bad ratio may place the firm in an insolvency state. Generally, a low debt to equity shows that the enterprise is financing most of its business activities with the money from the equity (Larasati and Rivai, 2020). On the other hand, a high ratio indicates the capital used in running the operations is generated from the debts.
Based on the analysis in the table above, the company’s debt to equity ratio is 0.6, which implies low debt is being used in the business operation. The status is essential for the growth of the firm because most of the profit generated will be used to pay dividends making investors contribute effectively to the organization. Similarly, in case of bankruptcy, the corporation can quickly pay its obligations efficiently. Despite the effectiveness of the low debt to equity ratio, over-relying on the firm’s assets to finance business operations may be catastrophic at some point, especially if the management fails to take appropriate measures.
Return on Assets (ROA)
ROA is a financial ratio that is used by most investors to determine the ability of a company to covert the available assets into net income. Firms with higher ROA are efficient and effective in generating more profits than those with low ROA. The standard rule has it that organizations with below 5% ROA are performing poorly while the ones having over 5% are considered to be on the safest side of business operation.
Based on the company’s financial analysis, the ROA is 15% which indicates a positive performance of the firm. The ratio is significant because it reflects the potential of the enterprise to utilize its resources to attain the set objectives. The value is viable, and it can enable the organization to attract more potential investors in the industry; this will allow the business entity to increase its capital base, thus making high returns.
Currency Exchange Risks
Currency risk or foreign exchange risk is the risk of financial loss that a multinational firm may incur due to fluctuations or volatility of the exchange rates in the international markets. These risks normally occur when the multinational firm conducts international transactions in currencies that are not of the country where it is headquartered (Lahmiri, 2017). For example, a UK company headquartered in the UK that does business in Nigeria and conducts international financial transactions in the Nigerian Naira is likely to be exposed to currency risks. When it tries to report the financial transactions in its financial statements in British Pound, the company will realize some significant changes. Similarly, Walt Disney Animation Studios can easily experience the effect following varied exchange rates in different countries it operates.
The risk during currency exchange that can expose the multinational firm to significant losses is often caused by strengthening or weakening the base currency utilized where the global firm is headquartered or strengthening or weakening the foreign currency used by the multinational to carry out international transactions.
Once Focus Academy begins operations and transactions, it is likely to face both translation and transaction exposure risks when revenues, liabilities, assets and expenses of its Nigerian subsidiary are converted into Sterling Pounds which the company uses in its financial statements. Transaction risk is a form of risk that multinational firms like will incur when making financial transactions in countries where their subsidiaries are based (Lahmiri, 2017). The risk occurs at the point of a change exchange rate just before the transaction is settled. The time delay that occurs between the translation and the transaction settlement is what often results to risk.
Risk Management
Forward contracts can be utilized by Focus Academy in situations where the movement of the prices of assets and investments are highly fluctuating. These contracts normally come in agreements to exchange the assets or investments at a particular price at an agreed date in the future. This setup allows the company or the investors to close their position before the end date of the agreement and get their cash back (Lahmiri, 2017). Companies that hedge in this manner usually tend to avoid the high level of fluctuation and weakness in the value of the assets. The signing of the agreement and deliberating on a particular price of the asset means that even if prices fluctuate, the cost of the asset that was agreed upon at the beginning of the contract will be relied upon. The company could use forward contracts to hedge the retained earnings of its subsidiary based in Nigeria, which has been experiencing a currency crisis over the last five years. A forward contract will protect the financial assets of the company from the currency exposure risk, and hence it will not suffer any serious losses.
Futures and Options
These types of derivatives nearly operate in a similar manner to forward contracts; however, they are more highly regulated than forward contracts in most countries and companies involved with them are most of the time forced to utilize them until the contract ends (Getmansky, Lee and Lo, 2015). It allows the company to decide to go long by agreeing to purchase the asset in future, or it can also decide to go short if the company plans to sell or dispose of the asset in the short term (Getmansky, Lee and Lo, 2015). Agreeing on future prices between the company and other parties involved in the hedging process means that uncertainties in the market conditions are often reduced.
Pairs Trading
This is the most common type of hedging used by both investors and companies to protect their financial assets and investments from exposure because of its reliability and neutrality in the financial markets. It is a long-short technique that can work with assets that do not belong to the same class as long as there is a connection between the two. The firm or traders involved in this hedging technique first are always required to determine which of the assets to be exchanged are over-valued and under-valued (Alexandridis, Chen and Zeng, 2021). The traders or the firms involved in the asset exchange can decide to buy a position that will go long on the under-valued asset while at the same time short-selling the overvalued asset. The two assets will then deliver profits to the firms when their values shift back to their original positions.
Use of Safe-Haven Assets
Gold Asset
Gold is a valuable metal used in commodity trading like other precious metals such as silver and aluminium. It is taken by many firms and investors as a safe haven or hedge for their assets due to its high stability, reliability and value in the financial markets. Over the past decades, as other assets such as cash lost worth, the value of gold has always remained constant and even risen in the face of global political and economic crises. Its consistency has made it a powerful asset that firms and individual investors utilize to hedge their other assets and investments against inflation and currency devaluation. Prices of gold often are inversely proportional to the stock market price, in that as the stock market becomes bearish, the prices of gold increase. Therefore, Focus academy, which seeks to operate in Nigeria where the currency is volatile and are devalued, can utilize gold to hedge its financial assets.
Government bonds
Government sovereign bonds such as treasuries are another form of investment that are often very stable and often not affected by economic volatility. Therefore, they offer firms and individual investors a safe haven to protect their assets against currency exposure. These bonds often repay the investors fixed returns at a constant rate until their expiry date, in which the government now pays their face value (Getmansky, Lee and Lo, 2015). However, despite its strength as an investment and hedging tool, these government bonds are still affected by fluctuation in interest rates, inflation, and stability of the currency. Sometimes, returns could be less in an economy frequented by high-interest rates and high inflation, a weak currency.
Currency Pairs
Some countries are stable economically and have stronger currency than the others.US has a very strong economy with a stable interest rate and utilizes the US dollar, which is also the reserve currency of the world. Because of the stability and strength of the US dollar, many multinational firms and also investors use it for international transactions and hence protect their financial assets and local investment against the volatility of their local currency. Switzerland is also a country with a stable economy, strong currency and low-volatile financial markets; hence its currency can also be another means that investors and firms from countries with weak currencies can protect their financial assets.
Benefits of the Hedging Techniques
Futures and options forms of hedging act as better short-term currency exposure mitigation tools for companies or traders that have a long-term outlook. When Focus Academy has excess cash reserves from net income and does not want to utilize the cash now for operational and investment activities, it can hedge the cash using the two hedging strategies and, therefore, protect them against loss of value.
Hedging tools can also be utilized by the firm to protect their profits against weak currencies and inflation. Hence the company will not be able to incur any losses from subsidiaries located in countries with unstable currencies. The application of hedging is one of the methods the company can use to survive challenging periods that it may face during the operating time. These periods include during an economic crisis, financial market collapse or political crisis. These crises often result in weak currencies, and hence to prevent losses due to currency exposure, companies can utilize techniques such as forward contracts to protect their cash from potential losses.
Hedging will also allow the company or individual investors to save time and thus focus on other essential things as most of the time it is long term and the company is guaranteed to get back their financial asset as agreed in the contract, and the company management will not have to waste time dealing with portfolio adjustment due to volatility of investments like stocks.
References List
Alexandridis, G., Chen, Z. and Zeng, Y., (2021) ‘Financial hedging and corporate investment,’ Journal of Corporate Finance, 67, p.101887.
Barrow, C., Barrow, P. and Brown, R., (2018). The Business plan workbook: A Step-By-Step guide to creating and developing a successful business. Kogan Page Publishers.
Getmansky, M., Lee, P.A. and Lo, A.W., (2015) ‘Hedge funds: A dynamic industry in transition,’ Annual Review of Financial Economics, 7, pp.483-577.
Hesser, F., Wohner, B., Meints, T., Stern, T. and Windsperger, A., (2017) ‘Integration of LCA in R&D by applying the concept of payback period: case study of a modified multilayer wood parquet.’ The International Journal of Life Cycle Assessment, 22(3), pp.307-316.
Lahmiri, S., (2017) ‘Modeling and predicting historical volatility in exchange rate markets,’ Physica A: Statistical Mechanics and its Applications, 471, pp.387-395.
Larasati, C. and Rivai, A., (2020) ‘Effect of debt to equity ratio and return on assets on earnings per share with firm value as a moderating variable in various industrial sub-sector manufacturing companies Indonesia,’ Asian Business Research Journal, 5, pp.39-47.
Nuryani, Y. and Sunarsi, D., (2020) ‘The Effect of Current Ratio and Debt to Equity Ratio on Deviding Growth,’ JASA (Jurnal Akuntansi, Audit dan Sistem Informasi Akuntansi), 4(2), pp.304-312.