Summary
Fruits, such as mangoes, pineapples, berries and papaya have diversified tastes and flavors, and make up excellent sources of various minerals and vitamins in the diet (Rababah, Ereifej & Howard 2005). Some substances that are essential for life may themselves cause adverse effects in human bodies. For instance, while oxygen may be essential for life, it can poison the body through the oxidation of essential molecules to form free radicals. The human body protects itself against such damaging effects of oxygen using antioxidants (Hickey & Saul, 2009).
Antioxidant refers to substances or mechanisms that prevent the oxidation of biomolecules in human bodies. Antioxidants check oxidation harm in human bodies by donating electrons to replace those lost through oxidation. Antioxidants neutralize free radicals in human bodies. Among the numerous antioxidants found in fruits, vitamin c has the most significant biological role in the human body. Vitamin C donates electrons to free radicals produced from oxidation and prevents them from taking electrons (reducing) from useful molecules in the body (Hickey & Saul 2009); thereby preventing disruption of such functional molecules. In fact, vitamin C plays numerous roles in the body.
Vitamin C helps to decrease levels of C-receptive protein (CRP) and to fight inflammations. In addition, blood levels of vitamin C less than 10µmol/L serve as predictors of heart disease (Cadenas & Packer 2001, p.157) threat of arteriosclerosis, and various forms of cancer. Citrus fruits and leafy vegetables contain L-Ascorbic acid in abundance (Brevard et al. 2010).
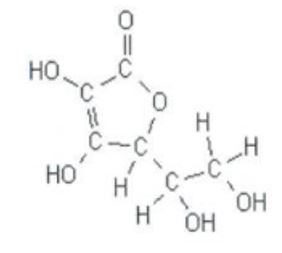
Vitamin C is necessary for human growth and repair of tissues, tendons, ligaments and blood vessels through the formation of collagen. According to Vasco & Ruales (2008, p. 817), the ease with which vitamin C oxidizes causes it to diminish faster in fresh fruits than in processed ones, and when cooked, or processed in the open air. Ascorbic acid is freely soluble in water, and therefore, tinned fruits retain their vitamin C in the liquid. Vitamin C is slightly acidic and is partially soluble in alcohol, and insoluble in chloroform, ether and benzene (Rickman, Barret & Bruhn 2007). The formula for ascorbic acid is C6H8O6 and the figure below represents its chemical structure:

Nutritional compounds present in fruits include vitamins, fats, proteins, minerals, and sugars. Indeed, fruits are the major dietary sources of vitamins A, E and C. The protective effects of a diet rich in fruit are attributed to bioactive compounds having anti-mutagenic and antioxidant activity. Sinha et al. (2012, p. 113) assert that retention of the antioxidant and consequent nutritional value of fruits is the primary goal of most processing procedures, of which freezing and frozen processing are amongst the few known less destructive procedures offering long-retention of vitamin C rich fruits.
Freezing procedures have a partial effect on the original Ascorbic acid content of fruits. The demise of ascorbic acid happens during frozen and freezing storage and manufacturers have employed this parameter to minimize the frozen processing duration of frozen fruit. The chief cause of vitamin C loss relates to the action of ascorbate oxidase (enzyme). Preservation effects of these processes based on the destruction of this enzyme. However, if freezing or pre-treatment techniques do not kill this enzyme, its activity will persist into the frozen phase. Degradation of ascorbic acid is a factor of elements such as time-temperature, fruit type and variety, nature of pre-treatments and/or freezing and packaging, among others (Sinha et al. 2012). These factors influence the retention of vitamin C in fruits differently. This paper discusses an experiment to evaluate the content of vitamin C in fruits using the colorimetric technique, which applies the Folin-Ciocalteu reagent, to compare vitamin C content in fresh pineapples and strawberries against processed pineapples and strawberries.
Experimental Design
This experiment will be comparing the content of vitamin C in fresh, frozen and canned fruits (pineapples and strawberries) using the direct colorimetric technique. Folin phenol reagent, which is an oxidizing agent, yields a blue color on reduction, and biochemists use it for estimating the amount of specific protein at pH 10 (Jagota & Dani 1982).
Requirements and Procedure
Reagents
- 10% trichloroacetic acid,
- Folin-Ciocalteu reagent 0.2 M,
- Ascorbic acid (stock) of 100 µg/ml,
- Double-distilled water.
Materials
- Fresh pineapples fruits and two or more tins of canned pineapples,
- Fresh strawberries fruits and two or more tins of canned strawberries, 4 replicates.
Equipment
- Refrigerator;
- Test Tubes;
- Paper filters;
- Analytical scale;
- Knives;
- Blenders/choppers;
- Funnel;
- Gloves;
- Lab coat;
- Spectrophotometer;
- centrifuge.
The Samples
Strawberry
Remove buds from the strawberries, transfer 250 g of the strawberries into a blender, and add 250 ml of double-distilled water. Blend for at least 20 minutes to produce a homogenate. Filter the strawberries juice into a conical flask and label it as ‘fresh strawberries’.
Blend 250 g of canned strawberries with 250 ml of distilled water for 20 minutes. Collect a filtrate of the strawberry juice in a conical flask and label it as ‘canned strawberries’. Preserve an equal number of strawberries cans at room temperature.
Pineapples
Wear protective hand gloves and peel off the skin of a fresh pineapple fruit using a sharp knife taking great caution to avoid cutting your fingers or palm. Chop the peeled pineapple into small bits and weigh 250 g of the pineapple slices into a clean blender. Add 250 ml of distilled water and blend to homogenize the fruit tissue (Porter 2012). Then filter the homogenate to extract a filtrate for the assay. Freeze extra pineapple fruits in the refrigerator with the above specification and preserve some in perforated boxes in the laboratory rack. Record the daily temperature and humidity of the laboratory.
Blend 250 g of canned pineapple with 250 ml of distilled water for 20 minutes. Collect filtrate of the pineapple juice in a conical flask and label it as ‘canned pineapple’. Preserve some pineapple fruit cans at room temperature and an equal number in the refrigerator below -10°C. Record the room temperature and humidity on daily basis.
Procedure to Estimate Vitamin C Content of the Samples
- Wear fresh gloves.
- Add 0.8 ml 10% trichloroacetic acid to 0.2 ml of freshly prepared pineapple juice. Check the test tubes vigorously and place them in an ice bath for 5 minutes. Thereafter, centrifuge the tubes at 3000 rpm for 5 minutes.
- Dilute 0.2 – 0.5 ml of the above extract to 2.0 ml with double-distilled water. Then add 0.2 ml of diluted Folin reagent.
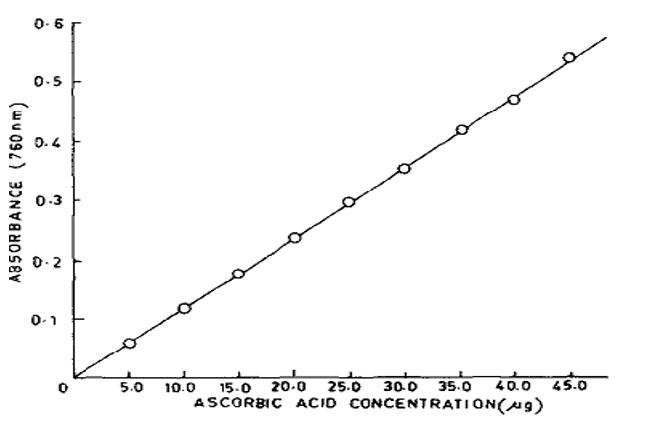
- Prepare a standard curve by taking 0.05 – 0.7 ml of standards solutions of ascorbic acid in double-distilled water.

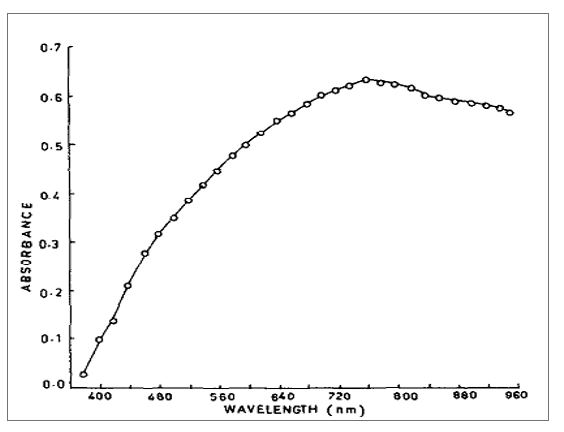
Fig. 1. Absorption spectra of color produce from the reaction of ascorbic acid with Folin. Source: Jagota & Dani (1982). - Repeat the above procedure for the other threes samples, including fresh strawberries fruit, canned pineapple, and canned strawberries. The experimenter must wear protective gear, particularly gloves, to prevent corrosive trichloroacetic acid and Folin-Ciocalteu from coming into contact with skin.
- Repeat the above steps 30 days later for the preserved samples and record observation to compare them with those of the first experiment.
Data Analysis
The calculation of the vitamin C content of the different samples will base on the standard curve of ascorbic acid shown in figure 2. The absorption of color is optimal at 760 nm wavelength. The standard curve of ascorbic is linear up to 45 µg of ascorbic acid and appears to deviate from Beer-Lambert law beyond this concentration.

Time Plan
Gantt Chart
References
Brevard, P, Marques, K, Renfroe, M, Lee, R & Gloeckner, J 2010, ‘Differences in Antioxidants Levels of Fresh, Frozen and Freeze-dried Strawberries and Strawberry Jam’, International Journal of Food Sciences and Nutrition, Vol 61 No.8, pp. 759-769.
Cadenas, E & Packer, L 2001, Handbook of Antioxidants, Mercel Dekker, Inc., New York.
Hickey, S & Saul, A 2009, Vitamin C: The Real Story, Steve Hickey & Andrew W. Saul, United States.
Jagota, S & Dani, H 1982, ‘A New Colorimetric Technique for the Estimation of Vitamin C Using Folin Phenol Reagent’, Analytical Biochemistry, Vol 127, pp. 178-182.
Porter, Y 2012, ‘Antioxidant Properties of Green Brocolli and Purple-Sprouting Brocolli Under Different Cooking Conditions’ Bioscience Horizon, Vol 5, pp. 1-11.
Rababah, T, Ereifej, K & Howard, L 2005, ‘Effects of Ascorbic Acid and Sehydration on Concentration of Total Phenolics, Antioxidants Capacity’, Anthocyanins, and Color in Fruits. J Agri Food Chem., Vol 53, pp. 4444-4447.
Rickman, J, Barret, D & Bruhn, C 2007, ‘Review: Nutritional Comparison of Fresh, Frozen and Canned Fruits and Vegetables, Part I. Vitamins C and B and Phenolic Compounds’, Journal of the Science of Food and Agriculture, Vol 87 No.7, pp. 930-944.
Sinha, N, Sidhu, J, Barta, J, Wu, J, & Cano, P 2012, Handbook of Fruits and Fruit Processing, Wiley-Blackwell, Ames, Iowa.
Vasco, C & Ruales, J 2008, ‘Total Phenolic Compounds and Antioxidants Capacities of Major Fruits from Ecuador’, Food Chem, Vol 111, pp. 816-823.